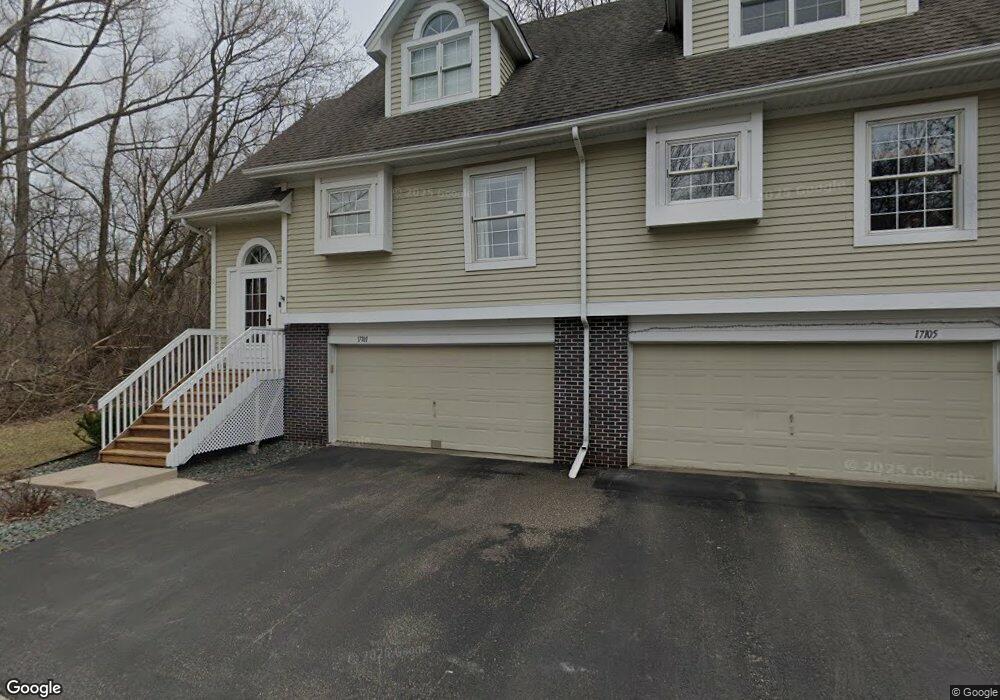
17101 Sandy Ln Minnetonka, MN 55345
Spring Hill Park NeighborhoodEstimated Value: $329,000 - $354,000
2
Beds
2
Baths
1,505
Sq Ft
$226/Sq Ft
Est. Value
About This Home
This home is located at 17101 Sandy Ln, Minnetonka, MN 55345 and is currently estimated at $340,751, approximately $226 per square foot. 17101 Sandy Ln is a home located in Hennepin County with nearby schools including Clear Springs Elementary School, Minnetonka West Middle School, and Minnetonka Senior High School.
Ownership History
Date
Name
Owned For
Owner Type
Purchase Details
Closed on
Jul 5, 2022
Sold by
Granrud Jens C and Granrud Pamela J
Bought by
Ayad Nadder
Current Estimated Value
Home Financials for this Owner
Home Financials are based on the most recent Mortgage that was taken out on this home.
Original Mortgage
$324,000
Outstanding Balance
$308,276
Interest Rate
5.1%
Mortgage Type
New Conventional
Estimated Equity
$32,475
Purchase Details
Closed on
Mar 13, 2019
Sold by
Granrud Pamela J and Granrud Jens C
Bought by
Granrud Pamela J
Purchase Details
Closed on
Jun 26, 2017
Sold by
Boisclair Colette A
Bought by
Granrud Pamela J and Granrud Jens C
Purchase Details
Closed on
Jun 1, 2016
Sold by
Kramin Darrell A and Lindahl Ashley I
Bought by
Boisclair Colette A
Purchase Details
Closed on
Mar 19, 2010
Sold by
Nelson Susan M and Mathisen Thomas A
Bought by
Lindahl Ashley I
Purchase Details
Closed on
Jun 15, 1998
Sold by
Copeland Judd S
Bought by
Nelson Susan M
Purchase Details
Closed on
Jul 11, 1997
Sold by
Wrigley Barbara A
Bought by
Copeland Judd S and Copeland Martha E
Create a Home Valuation Report for This Property
The Home Valuation Report is an in-depth analysis detailing your home's value as well as a comparison with similar homes in the area
Home Values in the Area
Average Home Value in this Area
Purchase History
| Date | Buyer | Sale Price | Title Company |
|---|---|---|---|
| Ayad Nadder | $360,000 | None Listed On Document | |
| Granrud Pamela J | -- | None Available | |
| Granrud Pamela J | $237,000 | None Available | |
| Boisclair Colette A | $224,000 | Custom Home Bldrs Title | |
| Lindahl Ashley I | $201,000 | -- | |
| Nelson Susan M | $159,000 | -- | |
| Copeland Judd S | $155,000 | -- |
Source: Public Records
Mortgage History
| Date | Status | Borrower | Loan Amount |
|---|---|---|---|
| Open | Ayad Nadder | $324,000 |
Source: Public Records
Tax History
| Year | Tax Paid | Tax Assessment Tax Assessment Total Assessment is a certain percentage of the fair market value that is determined by local assessors to be the total taxable value of land and additions on the property. | Land | Improvement |
|---|---|---|---|---|
| 2024 | $4,191 | $330,800 | $55,500 | $275,300 |
| 2023 | $4,230 | $343,000 | $55,500 | $287,500 |
| 2022 | $4,198 | $342,100 | $55,500 | $286,600 |
| 2021 | $3,933 | $304,500 | $50,000 | $254,500 |
| 2020 | $3,611 | $286,000 | $50,000 | $236,000 |
| 2019 | $3,438 | $251,500 | $50,000 | $201,500 |
| 2018 | $2,949 | $238,400 | $50,000 | $188,400 |
| 2017 | $2,786 | $190,500 | $35,000 | $155,500 |
| 2016 | $2,848 | $194,100 | $35,000 | $159,100 |
| 2015 | $2,798 | $189,500 | $30,000 | $159,500 |
| 2014 | -- | $160,000 | $30,000 | $130,000 |
Source: Public Records
Map
Nearby Homes
- 4944 W West End Ln
- 4939 Bayswater Rd
- 5026 Clear Spring Dr
- 16633 Temple Dr N
- 4801 Spring Cir
- 4757 Spring Cir
- 4553 Aspenwood Trail
- 16826 Excelsior Blvd
- 4321 Lancelot Dr
- 16515 Hilltop Terrace
- 18213 Hermitage Way
- 17100 Hampton Ct
- 4261 Winchester Ct
- 5034 Sparrow Rd
- 15904 Dawn Dr
- 4902 Woodhurst Ln
- 4414 Juleena Place
- 4108 Dublin Dr
- 15710 Highwood Dr
- 5616 Mahoney Ave
- 17105 Sandy Ln
- 17109 Sandy Ln
- 17113 Sandy Ln
- 17100 Sandy Ln
- 17104 Sandy Ln
- 17108 Sandy Ln
- 4932 Clear Spring Rd
- 17112 Sandy Ln
- 4938 Clear Spring Rd
- 17141 Sandy Ln
- 4926 Clear Spring Rd
- 4944 Clear Spring Rd
- 4917 Carlysle Place
- 17149 Sandy Ln
- 4915 Carlysle Place
- 4913 Carlysle Place
- 4911 Carlysle Place
- 17155 Sandy Ln
- 4950 Clear Spring Rd
- 4914 Clear Spring Rd
Your Personal Tour Guide
Ask me questions while you tour the home.