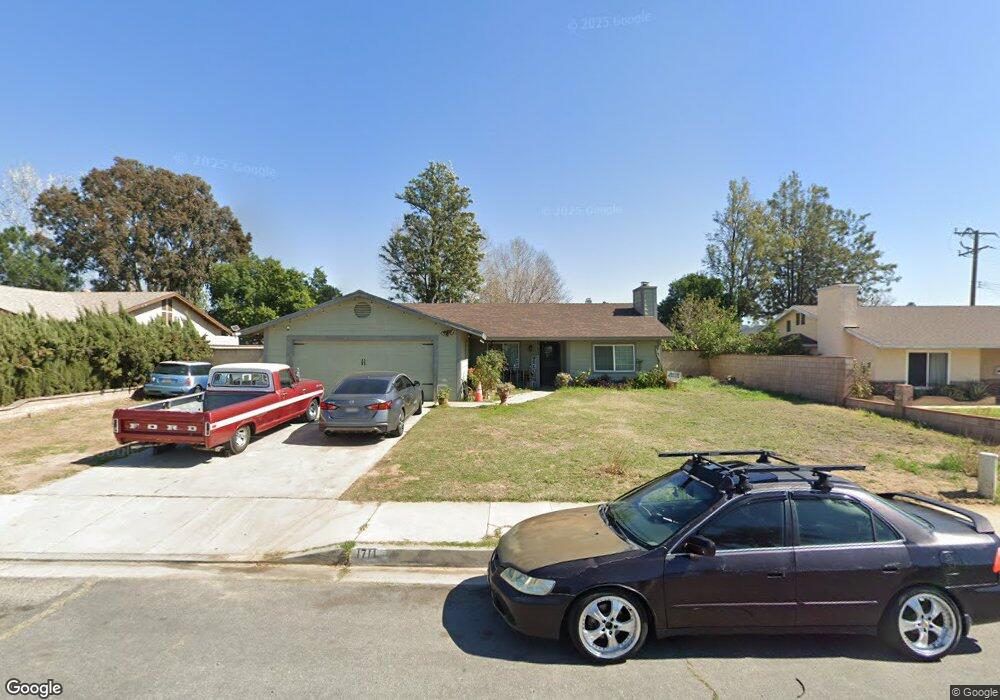
1711 N Alice Ave Rialto, CA 92376
Estimated Value: $495,653 - $561,000
3
Beds
2
Baths
1,288
Sq Ft
$419/Sq Ft
Est. Value
About This Home
This home is located at 1711 N Alice Ave, Rialto, CA 92376 and is currently estimated at $539,913, approximately $419 per square foot. 1711 N Alice Ave is a home located in San Bernardino County with nearby schools including Preston Elementary School, Kolb Middle School, and Wilmer Amina Carter High School.
Ownership History
Date
Name
Owned For
Owner Type
Purchase Details
Closed on
Jun 12, 2011
Sold by
Fannie Mae
Bought by
Vazquez Esteban M and Vazquez Maria De Jesus
Current Estimated Value
Home Financials for this Owner
Home Financials are based on the most recent Mortgage that was taken out on this home.
Original Mortgage
$154,969
Outstanding Balance
$106,481
Interest Rate
4.56%
Mortgage Type
FHA
Estimated Equity
$433,432
Purchase Details
Closed on
Nov 11, 2010
Sold by
Dela Cruz Maria C
Bought by
Federal National Mortgage Association
Purchase Details
Closed on
Sep 27, 2005
Sold by
Wubishet Abraham and Teklemariam Aster
Bought by
Dela Cruz Maria C
Home Financials for this Owner
Home Financials are based on the most recent Mortgage that was taken out on this home.
Original Mortgage
$288,000
Interest Rate
6.25%
Mortgage Type
Purchase Money Mortgage
Create a Home Valuation Report for This Property
The Home Valuation Report is an in-depth analysis detailing your home's value as well as a comparison with similar homes in the area
Home Values in the Area
Average Home Value in this Area
Purchase History
| Date | Buyer | Sale Price | Title Company |
|---|---|---|---|
| Vazquez Esteban M | $159,000 | Old Republic Title Company | |
| Federal National Mortgage Association | $332,420 | Pacific Coast Title | |
| Dela Cruz Maria C | $360,000 | United Title |
Source: Public Records
Mortgage History
| Date | Status | Borrower | Loan Amount |
|---|---|---|---|
| Open | Vazquez Esteban M | $154,969 | |
| Previous Owner | Dela Cruz Maria C | $288,000 |
Source: Public Records
Tax History Compared to Growth
Tax History
| Year | Tax Paid | Tax Assessment Tax Assessment Total Assessment is a certain percentage of the fair market value that is determined by local assessors to be the total taxable value of land and additions on the property. | Land | Improvement |
|---|---|---|---|---|
| 2025 | $2,861 | $203,707 | $51,247 | $152,460 |
| 2024 | $2,861 | $199,713 | $50,242 | $149,471 |
| 2023 | $3,025 | $195,797 | $49,257 | $146,540 |
| 2022 | $2,801 | $191,958 | $48,291 | $143,667 |
| 2021 | $2,785 | $188,194 | $47,344 | $140,850 |
| 2020 | $2,791 | $186,265 | $46,859 | $139,406 |
| 2019 | $2,735 | $182,613 | $45,940 | $136,673 |
| 2018 | $2,645 | $179,032 | $45,039 | $133,993 |
| 2017 | $2,547 | $175,522 | $44,156 | $131,366 |
| 2016 | $2,263 | $172,080 | $43,290 | $128,790 |
| 2015 | $2,273 | $169,495 | $42,640 | $126,855 |
| 2014 | $2,138 | $166,175 | $41,805 | $124,370 |
Source: Public Records
Map
Nearby Homes
- 178 W Walnut Ave Unit D
- 1839 N Millard Ave
- 160 W Cascade Dr
- 301 W Easton St
- 1760 N Vista Ave
- 1861 N Lilac Ave
- 19487 Chaparral St
- 358 E Walnut Ave
- 1973 N Sage Ave
- 1788 N Acacia Ave
- 6795 Fillmore Ave
- 19538 Cheshire St
- 242 W Jackson St
- 264 W Jackson St
- 6210 Riverside Ave
- 2451 Gunner Ridge Way
- 153 E Jackson St
- 454 E Mariposa Dr
- 249 E Jackson St
- 763 W Virginia St
- 1723 N Alice Ave
- 1703 N Alice Ave
- 1737 N Alice Ave
- 1679 N Alice Ave
- 194 W Walnut Ave Unit A
- 194 W Walnut Ave Unit B
- 194 W Walnut Ave Unit C
- 194 W Walnut Ave Unit D
- 237 W Lurelane St
- 1724 N Alice Ave
- 188 W Walnut Ave
- 188 W Walnut Ave
- 188 W Walnut Ave Unit A
- 188 W Walnut Ave Unit B
- 188 W Walnut Ave Unit C
- 188 W Walnut Ave Unit D
- 184 W Walnut Ave Unit E
- 184 W Walnut Ave
- 184 W Walnut Ave Unit A
- 184 W Walnut Ave Unit B