1711 N Crilly Ct Unit 1711B Chicago, IL 60614
Old Town NeighborhoodEstimated Value: $485,000 - $626,000
--
Bed
--
Bath
--
Sq Ft
1.01
Acres
About This Home
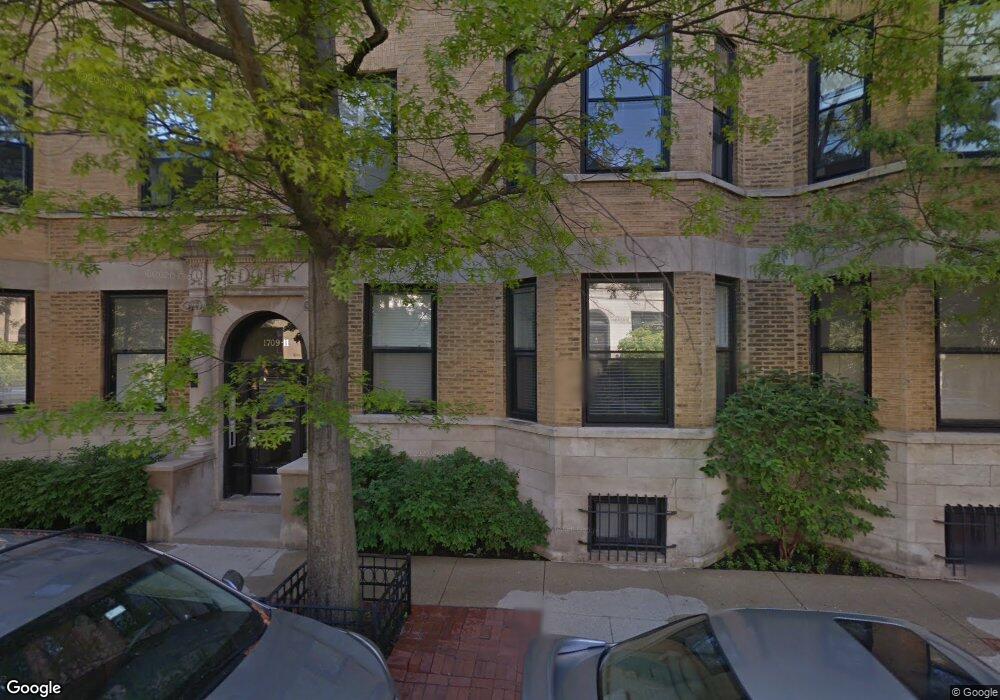
This home is located at 1711 N Crilly Ct Unit 1711B, Chicago, IL 60614 and is currently estimated at $578,505. 1711 N Crilly Ct Unit 1711B is a home located in Cook County with nearby schools including Abraham Lincoln Elementary School, Lincoln Park High School, and Immaculate Conception - St. Joseph School.
Ownership History
Date
Name
Owned For
Owner Type
Purchase Details
Closed on
Apr 15, 2018
Sold by
Edgar House Llc
Bought by
Metcalf Alyssa M
Current Estimated Value
Home Financials for this Owner
Home Financials are based on the most recent Mortgage that was taken out on this home.
Original Mortgage
$156,800
Outstanding Balance
$135,033
Interest Rate
4.5%
Mortgage Type
New Conventional
Estimated Equity
$443,472
Purchase Details
Closed on
Sep 28, 2015
Sold by
Dreifuss David T
Bought by
Edgar House Llc
Purchase Details
Closed on
May 18, 2007
Sold by
1701 Crilly Llc
Bought by
Darche Randall and Payne Christine
Home Financials for this Owner
Home Financials are based on the most recent Mortgage that was taken out on this home.
Original Mortgage
$311,920
Interest Rate
6.2%
Mortgage Type
New Conventional
Create a Home Valuation Report for This Property
The Home Valuation Report is an in-depth analysis detailing your home's value as well as a comparison with similar homes in the area
Home Values in the Area
Average Home Value in this Area
Purchase History
| Date | Buyer | Sale Price | Title Company |
|---|---|---|---|
| Metcalf Alyssa M | $448,000 | Attorneys Title Guaranty Fun | |
| Edgar House Llc | -- | Attorney | |
| Darche Randall | $390,000 | Fidelity Natl Title Ins Co |
Source: Public Records
Mortgage History
| Date | Status | Borrower | Loan Amount |
|---|---|---|---|
| Open | Metcalf Alyssa M | $156,800 | |
| Previous Owner | Darche Randall | $311,920 |
Source: Public Records
Tax History Compared to Growth
Tax History
| Year | Tax Paid | Tax Assessment Tax Assessment Total Assessment is a certain percentage of the fair market value that is determined by local assessors to be the total taxable value of land and additions on the property. | Land | Improvement |
|---|---|---|---|---|
| 2024 | $8,891 | $47,554 | $7,676 | $39,878 |
| 2023 | $8,646 | $45,456 | $6,191 | $39,265 |
| 2022 | $8,646 | $45,456 | $6,191 | $39,265 |
| 2021 | $8,471 | $45,454 | $6,190 | $39,264 |
| 2020 | $8,133 | $39,610 | $5,447 | $34,163 |
| 2019 | $8,643 | $43,020 | $5,447 | $37,573 |
| 2018 | $8,498 | $43,020 | $5,447 | $37,573 |
| 2017 | $8,525 | $39,601 | $4,457 | $35,144 |
| 2016 | $7,932 | $39,601 | $4,457 | $35,144 |
| 2015 | $6,776 | $39,601 | $4,457 | $35,144 |
| 2014 | $6,472 | $37,453 | $3,342 | $34,111 |
| 2013 | $6,812 | $37,453 | $3,342 | $34,111 |
Source: Public Records
Map
Nearby Homes
- 1636 N Wells St Unit 615
- 1636 N Wells St Unit 1001
- 1636 N Wells St Unit 3007
- 1636 N Wells St Unit 707
- 1636 N Wells St Unit 2501
- 1636 N Wells St Unit 2014
- 1740 N Clark St Unit 1733
- 1760 N Wells St Unit 2A
- 1660 N La Salle Dr Unit 2508
- 1660 N La Salle Dr Unit 307
- 1660 N La Salle Dr Unit 1108
- 328 W Concord Place
- 314 W Menomonee St
- 1658 N Sedgwick St Unit 3N
- 1630 N Sedgwick St Unit 2
- 1540 N La Salle Dr Unit 501
- 1540 N La Salle Dr Unit 301
- 1850 N Clark St Unit 2202
- 1850 N Clark St Unit 2008
- 1850 N Clark St Unit 707
- 1711 N Crilly Ct Unit 17112
- 1711 N Crilly Ct Unit 17111
- 1711 N Crilly Ct Unit 17113
- 1711 N Crilly Ct Unit N14
- 1711 N Crilly Ct Unit 17114
- 1711 N Crilly Ct
- 1711 N Crilly Ct Unit 2
- 1711 N Crilly Ct Unit 3
- 1711 N Crilly Ct Unit 1
- 1711 N Crilly Ct Unit B
- 1709 N Crilly Ct Unit 3W
- 1709 N Crilly Ct Unit S9
- 1709 N Crilly Ct Unit 17094E
- 1709 N Crilly Ct Unit 17093E
- 1709 N Crilly Ct Unit 17092E
- 1709 N Crilly Ct Unit 17091W
- 1709 N Crilly Ct Unit S17
- 1709 N Crilly Ct Unit S16
- 1709 N Crilly Ct Unit S8
- 1709 N Crilly Ct Unit S5