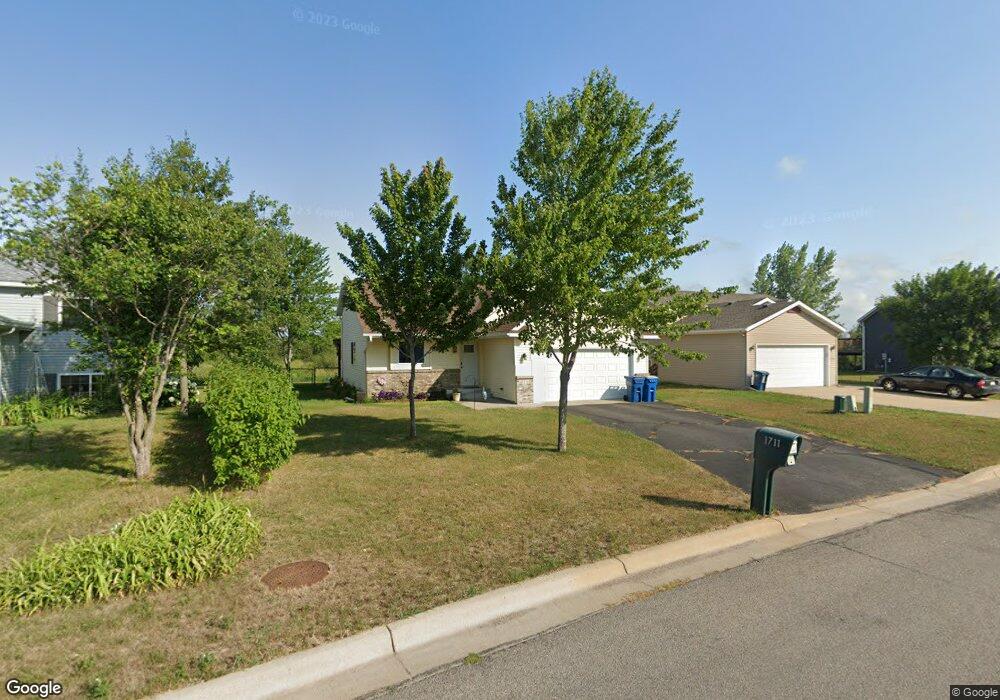
1711 Peach Dr NE Sauk Rapids, MN 56379
Estimated Value: $271,379 - $310,000
3
Beds
2
Baths
1,021
Sq Ft
$289/Sq Ft
Est. Value
About This Home
This home is located at 1711 Peach Dr NE, Sauk Rapids, MN 56379 and is currently estimated at $295,095, approximately $289 per square foot. 1711 Peach Dr NE is a home located in Benton County with nearby schools including Mississippi Heights Elementary School, Sauk Rapids-Rice Middle School, and Sauk Rapids-Rice Senior High School.
Ownership History
Date
Name
Owned For
Owner Type
Purchase Details
Closed on
Jun 29, 2016
Sold by
Rueckert Katie Katie
Bought by
Turnow Caryl Caryl
Current Estimated Value
Home Financials for this Owner
Home Financials are based on the most recent Mortgage that was taken out on this home.
Original Mortgage
$149,900
Outstanding Balance
$119,588
Interest Rate
3.56%
Estimated Equity
$175,507
Purchase Details
Closed on
Sep 27, 2010
Sold by
Secretary Of Hud
Bought by
Dockendorf Katie Louise
Home Financials for this Owner
Home Financials are based on the most recent Mortgage that was taken out on this home.
Original Mortgage
$103,604
Interest Rate
4.5%
Mortgage Type
FHA
Purchase Details
Closed on
Jan 5, 2009
Sold by
Wells Fargo Bank Na
Bought by
Secretary Of Hud Of Washington Dc
Create a Home Valuation Report for This Property
The Home Valuation Report is an in-depth analysis detailing your home's value as well as a comparison with similar homes in the area
Home Values in the Area
Average Home Value in this Area
Purchase History
| Date | Buyer | Sale Price | Title Company |
|---|---|---|---|
| Turnow Caryl Caryl | $149,900 | -- | |
| Dockendorf Katie Louise | -- | -- | |
| Secretary Of Hud Of Washington Dc | -- | -- |
Source: Public Records
Mortgage History
| Date | Status | Borrower | Loan Amount |
|---|---|---|---|
| Open | Turnow Caryl Caryl | $149,900 | |
| Previous Owner | Dockendorf Katie Louise | $103,604 |
Source: Public Records
Tax History Compared to Growth
Tax History
| Year | Tax Paid | Tax Assessment Tax Assessment Total Assessment is a certain percentage of the fair market value that is determined by local assessors to be the total taxable value of land and additions on the property. | Land | Improvement |
|---|---|---|---|---|
| 2025 | $3,108 | $266,000 | $31,000 | $235,000 |
| 2024 | $3,126 | $261,100 | $31,000 | $230,100 |
| 2023 | $2,970 | $267,700 | $31,000 | $236,700 |
| 2022 | $2,764 | $235,200 | $28,200 | $207,000 |
| 2021 | $2,462 | $202,700 | $28,200 | $174,500 |
| 2018 | $2,100 | $140,600 | $23,347 | $117,253 |
| 2017 | $2,100 | $127,200 | $22,844 | $104,356 |
| 2016 | $2,046 | $147,300 | $27,100 | $120,200 |
| 2015 | $2,076 | $113,900 | $22,254 | $91,646 |
| 2014 | -- | $107,200 | $21,925 | $85,275 |
| 2013 | -- | $96,400 | $21,309 | $75,091 |
Source: Public Records
Map
Nearby Homes
- xxx Lot 3
- 1526 Prairie View Ln NE
- 1294 Stone Ridge Rd
- 1424 Hillside Ct
- xxx Lot 2
- 55xx Mayhew Lake Rd NE
- 1408 10th St NE
- 1664 Payton Ct NE
- TBD Lot D Mayhew Lake Rd NE
- 1000 10th Ave NE
- 970 Golden Spike Rd NE
- 880 Golden Spike Rd NE
- 1 Skyview Dr
- XXXX Golden Spike Rd NE
- 1930 Prospect Dr NE
- tbd 25th Ave NE
- 1021 5th St S
- 2148 Morningside Dr NE
- 100 9th Ave S
- 1355 Onyx Way NE
- 1721 Peach Dr NE
- 1627 Peach Dr NE
- 1615 Peach Dr NE
- 1733 Peach Dr NE
- 1706 Peach Dr NE
- 1724 Peach Dr NE
- 1741 Peach Dr NE
- 1608 Peach Dr NE
- 1757 Peach Dr NE
- 1598 Peach Dr NE
- 1599 Peach Dr NE
- 1607 Plum Ct NE
- 1748 Peach Dr NE
- 1767 Peach Dr NE
- 1586 Peach Dr NE
- 1587 Peach Dr NE
- 1760 Peach Dr NE
- 1704 Perennial Ln NE
- 1775 Peach Dr NE
- 1600 Plum Ct NE