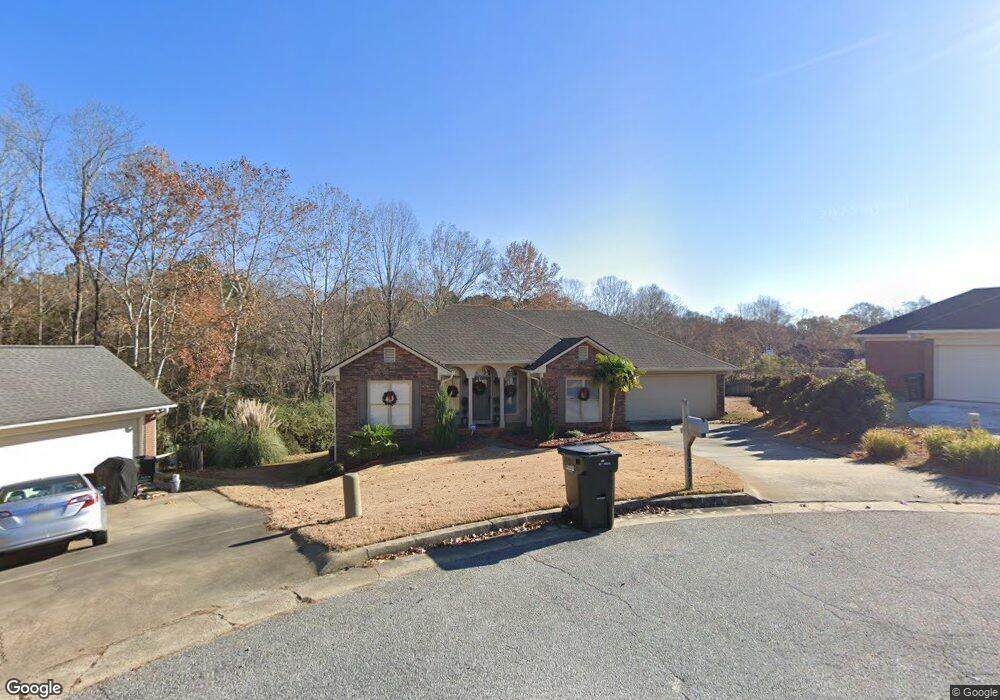
1711 Tom Buk Tu Ln Columbus, GA 31904
North Columbus NeighborhoodEstimated Value: $290,999 - $323,000
3
Beds
2
Baths
1,900
Sq Ft
$163/Sq Ft
Est. Value
About This Home
This home is located at 1711 Tom Buk Tu Ln, Columbus, GA 31904 and is currently estimated at $310,500, approximately $163 per square foot. 1711 Tom Buk Tu Ln is a home located in Muscogee County with nearby schools including Double Churches Elementary School, Double Churches Middle School, and Northside High School.
Ownership History
Date
Name
Owned For
Owner Type
Purchase Details
Closed on
Jun 30, 2021
Sold by
Lusk Michael James
Bought by
Lusk Larvee Norris
Current Estimated Value
Purchase Details
Closed on
Nov 13, 2020
Sold by
Hutchins David Brent
Bought by
Lusk Michael James
Home Financials for this Owner
Home Financials are based on the most recent Mortgage that was taken out on this home.
Original Mortgage
$225,060
Interest Rate
2.8%
Mortgage Type
VA
Purchase Details
Closed on
Jun 5, 2018
Sold by
Quicken Loans Inc
Bought by
Secretary Of Veterans Affairs
Purchase Details
Closed on
Apr 8, 2014
Sold by
Ditto Birgit
Bought by
Ditto Birgit and Ditto Robert
Home Financials for this Owner
Home Financials are based on the most recent Mortgage that was taken out on this home.
Original Mortgage
$153,658
Interest Rate
4.43%
Mortgage Type
VA
Create a Home Valuation Report for This Property
The Home Valuation Report is an in-depth analysis detailing your home's value as well as a comparison with similar homes in the area
Home Values in the Area
Average Home Value in this Area
Purchase History
| Date | Buyer | Sale Price | Title Company |
|---|---|---|---|
| Lusk Larvee Norris | -- | -- | |
| Lusk Michael James | $220,000 | -- | |
| Secretary Of Veterans Affairs | $138,683 | -- | |
| Quicken Loans Inc | $138,683 | -- | |
| Ditto Birgit | -- | -- |
Source: Public Records
Mortgage History
| Date | Status | Borrower | Loan Amount |
|---|---|---|---|
| Previous Owner | Lusk Michael James | $225,060 | |
| Previous Owner | Ditto Birgit | $153,658 |
Source: Public Records
Tax History Compared to Growth
Tax History
| Year | Tax Paid | Tax Assessment Tax Assessment Total Assessment is a certain percentage of the fair market value that is determined by local assessors to be the total taxable value of land and additions on the property. | Land | Improvement |
|---|---|---|---|---|
| 2025 | $2,929 | $110,404 | $12,748 | $97,656 |
| 2024 | $2,928 | $110,404 | $12,748 | $97,656 |
| 2023 | $2,252 | $110,404 | $12,748 | $97,656 |
| 2022 | $3,053 | $84,696 | $12,748 | $71,948 |
| 2021 | $3,046 | $88,000 | $12,600 | $75,400 |
| 2020 | $2,742 | $67,132 | $12,748 | $54,384 |
| 2019 | $2,178 | $53,160 | $10,000 | $43,160 |
| 2018 | $1,470 | $67,592 | $12,748 | $54,844 |
| 2017 | $1,476 | $67,592 | $12,748 | $54,844 |
| 2016 | $1,483 | $54,874 | $10,072 | $44,802 |
| 2015 | $1,485 | $54,874 | $10,072 | $44,802 |
| 2014 | $1,488 | $54,874 | $10,072 | $44,802 |
| 2013 | -- | $54,874 | $10,072 | $44,802 |
Source: Public Records
Map
Nearby Homes
- 8008 Lagoon Ct
- 1512 Tom Buk Tu Ln
- 7313 Sesame St
- 6818 Fawndale Dr
- 6810 Fawndale Dr
- 6817 Whitesville Rd
- 1430 Cloverdale Rd
- 7407 Peppercorn Dr
- 6825 Ellis Dr
- 6802 Ellis Dr
- 1355 Cloverdale Rd
- 7047 Mellwood Rd
- 1719 Double Churches Rd
- 1440 Blanchfield Dr
- 1438 Grove Park Dr Unit 13B
- 6836 Sharmel Ln
- 1287 Woodville Ct
- 6969 Mobley Rd
- 7233 Mobley Walk Dr
- 1535 Doubletree Dr
- 1708 Tom Buk Tu Ln
- 1707 Tom Buk Tu Ln
- 5950 Beaver Pond Ct
- 5953 Beaver Pond Ct
- 1704 Tom Buk Tu Ln
- 1701 Tom Buk Tu Ln
- 5949 Beaver Pond Ct
- 5946 Beaver Pond Ct
- 6970 Buckhorn Dr
- 6950 Buckhorn Dr
- 8027 Lagoon Ct
- 1713 Beaver Pond Dr
- 1709 Beaver Pond Dr
- 6944 Buckhorn Dr
- 8030 Lagoon Ct
- 6976 Buckhorn Dr
- 5940 Beaver Pond Ct
- 8023 Lagoon Ct
- 1705 Beaver Pond Dr
- 6999 Buckhorn Dr