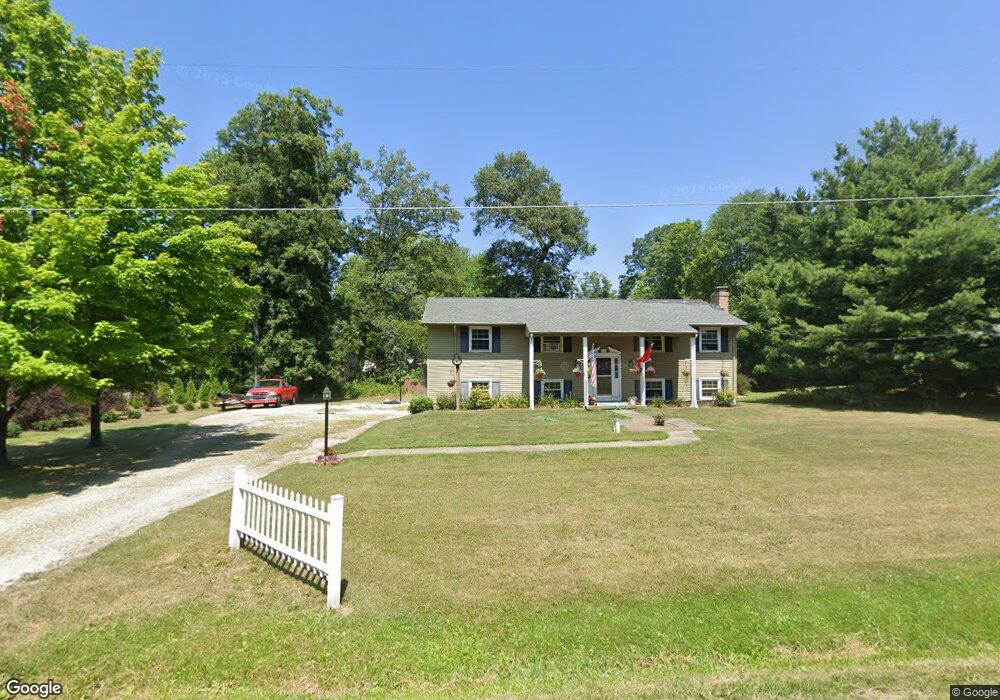
1711 Township Road 1153 Ashland, OH 44805
Estimated Value: $291,000 - $317,000
3
Beds
2
Baths
1,448
Sq Ft
$210/Sq Ft
Est. Value
About This Home
This home is located at 1711 Township Road 1153, Ashland, OH 44805 and is currently estimated at $303,708, approximately $209 per square foot. 1711 Township Road 1153 is a home located in Ashland County with nearby schools including Hillsdale Elementary School, Hillsdale Middle School, and Hillsdale High School.
Ownership History
Date
Name
Owned For
Owner Type
Purchase Details
Closed on
Apr 19, 2022
Sold by
Long Todd E and Long Kathy L
Bought by
Taylor David and Taylor Jordan
Current Estimated Value
Home Financials for this Owner
Home Financials are based on the most recent Mortgage that was taken out on this home.
Original Mortgage
$172,975
Outstanding Balance
$161,778
Interest Rate
3.85%
Mortgage Type
New Conventional
Estimated Equity
$141,930
Purchase Details
Closed on
Oct 14, 2015
Sold by
Long Jim C and Long Helen M
Bought by
Long Todd E and Long Kathy L
Home Financials for this Owner
Home Financials are based on the most recent Mortgage that was taken out on this home.
Original Mortgage
$101,750
Interest Rate
3.75%
Mortgage Type
FHA
Purchase Details
Closed on
Sep 3, 2010
Bought by
Long Jim C and Long Helen M
Purchase Details
Closed on
Aug 18, 2009
Sold by
Carter Chester L
Purchase Details
Closed on
Dec 13, 2007
Bought by
Carter Chester L
Purchase Details
Closed on
Nov 12, 1993
Bought by
Carter Chester L
Create a Home Valuation Report for This Property
The Home Valuation Report is an in-depth analysis detailing your home's value as well as a comparison with similar homes in the area
Home Values in the Area
Average Home Value in this Area
Purchase History
| Date | Buyer | Sale Price | Title Company |
|---|---|---|---|
| Taylor David | $125 | None Listed On Document | |
| Long Todd E | $122,000 | Attorney Only | |
| Long Jim C | $60,900 | -- | |
| -- | $92,000 | -- | |
| Carter Chester L | -- | -- | |
| Carter Chester L | $7,500 | -- |
Source: Public Records
Mortgage History
| Date | Status | Borrower | Loan Amount |
|---|---|---|---|
| Open | Taylor David | $172,975 | |
| Previous Owner | Long Todd E | $101,750 |
Source: Public Records
Tax History Compared to Growth
Tax History
| Year | Tax Paid | Tax Assessment Tax Assessment Total Assessment is a certain percentage of the fair market value that is determined by local assessors to be the total taxable value of land and additions on the property. | Land | Improvement |
|---|---|---|---|---|
| 2024 | $2,472 | $74,620 | $10,240 | $64,380 |
| 2023 | $2,472 | $74,620 | $10,240 | $64,380 |
| 2022 | $2,159 | $51,460 | $7,060 | $44,400 |
| 2021 | $2,162 | $51,460 | $7,060 | $44,400 |
| 2020 | $2,026 | $51,460 | $7,060 | $44,400 |
| 2019 | $1,946 | $47,990 | $7,270 | $40,720 |
| 2018 | $1,880 | $47,990 | $7,270 | $40,720 |
| 2017 | $1,651 | $47,990 | $7,270 | $40,720 |
| 2016 | $1,651 | $41,730 | $6,320 | $35,410 |
| 2015 | $1,673 | $41,730 | $6,320 | $35,410 |
| 2013 | $1,897 | $44,090 | $6,470 | $37,620 |
Source: Public Records
Map
Nearby Homes
- 1015 Township Road 1696
- 1690 County Road 995
- 1581 County Road 995
- 1111 Columbus Cir N
- 1696 Township Road 1419
- 1106 County Road 30a
- 1183 County Road 30a
- 19 Maine St
- 1706 Kingwood Ct
- 963 Avalon Dr
- 3290 Shad Dr W
- 945 Pike Dr
- 1170 Township Road 1426
- 0 Twp Rd 1806 Unit 11591470
- 531 Keen Ave
- 1026 Claremont Ave
- 1653 Ohio 60
- 1707 1153
- 1713 1153
- 1707 Township Road 1153
- 1713 Township Road 1153
- 1710 Township Road 1153
- 1712 Township Road 1153
- 1155 Township Road 1704
- 1716 Township Road 1153
- 1721 Township Road 1153
- 1718 Township Road 1153
- 1137 Township Road 1704
- 1720 Township Road 1153
- 1135 Township Road 1704
- 1724 Township Road 1153
- 1138 Township Road 1704
- 1723 Township Road 1153
- 1724 1153
- 1131 Township Road 1704
- 1134 Township Road 1704 Unit 1704
- 1134 Township Road 1704