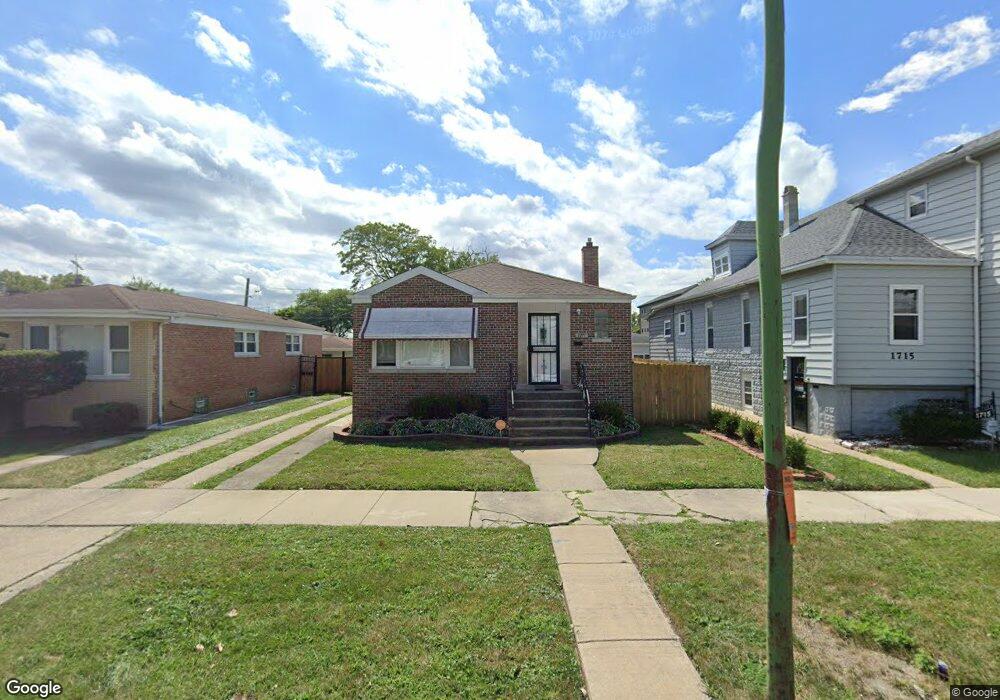
1711 W Steuben St Chicago, IL 60643
Morgan Park NeighborhoodEstimated Value: $152,550 - $171,000
2
Beds
1
Bath
840
Sq Ft
$189/Sq Ft
Est. Value
About This Home
This home is located at 1711 W Steuben St, Chicago, IL 60643 and is currently estimated at $159,138, approximately $189 per square foot. 1711 W Steuben St is a home located in Cook County with nearby schools including John D. Shoop Elementary School, Morgan Park High School, and Morgan Park Academy.
Ownership History
Date
Name
Owned For
Owner Type
Purchase Details
Closed on
May 26, 2015
Sold by
Grant Kevin
Bought by
Clash Shavon
Current Estimated Value
Home Financials for this Owner
Home Financials are based on the most recent Mortgage that was taken out on this home.
Original Mortgage
$84,452
Outstanding Balance
$64,660
Interest Rate
3.75%
Mortgage Type
FHA
Estimated Equity
$94,478
Purchase Details
Closed on
May 11, 2009
Sold by
Wells Fargo Bank Na
Bought by
Grant Kevin
Purchase Details
Closed on
Mar 16, 2009
Sold by
Cannon
Bought by
Wells Fargo Bank Na
Purchase Details
Closed on
Jun 2, 2005
Sold by
Laine Carolyn Renee
Bought by
Cannon David
Home Financials for this Owner
Home Financials are based on the most recent Mortgage that was taken out on this home.
Original Mortgage
$108,300
Interest Rate
8.6%
Mortgage Type
Fannie Mae Freddie Mac
Purchase Details
Closed on
May 28, 1997
Sold by
Rogers Theodore and Rogers Glover N
Bought by
Laine Carolyn Renee
Home Financials for this Owner
Home Financials are based on the most recent Mortgage that was taken out on this home.
Original Mortgage
$55,190
Interest Rate
8.13%
Create a Home Valuation Report for This Property
The Home Valuation Report is an in-depth analysis detailing your home's value as well as a comparison with similar homes in the area
Home Values in the Area
Average Home Value in this Area
Purchase History
| Date | Buyer | Sale Price | Title Company |
|---|---|---|---|
| Clash Shavon | $94,000 | Fidelity National Title | |
| Grant Kevin | $30,000 | Premier Title Company | |
| Wells Fargo Bank Na | -- | None Available | |
| Cannon David | $114,000 | Residential Title Services | |
| Laine Carolyn Renee | $57,000 | Intercounty Title |
Source: Public Records
Mortgage History
| Date | Status | Borrower | Loan Amount |
|---|---|---|---|
| Open | Clash Shavon | $84,452 | |
| Previous Owner | Cannon David | $108,300 | |
| Previous Owner | Laine Carolyn Renee | $55,190 |
Source: Public Records
Tax History
| Year | Tax Paid | Tax Assessment Tax Assessment Total Assessment is a certain percentage of the fair market value that is determined by local assessors to be the total taxable value of land and additions on the property. | Land | Improvement |
|---|---|---|---|---|
| 2025 | $1,414 | $9,200 | $3,780 | $5,420 |
| 2024 | $1,414 | $9,200 | $3,780 | $5,420 |
| 2023 | $1,357 | $10,000 | $4,095 | $5,905 |
| 2022 | $1,357 | $10,000 | $4,095 | $5,905 |
| 2021 | $1,345 | $10,000 | $4,095 | $5,905 |
| 2020 | $1,233 | $8,624 | $4,095 | $4,529 |
| 2019 | $1,218 | $9,477 | $4,095 | $5,382 |
| 2018 | $1,196 | $9,477 | $4,095 | $5,382 |
| 2017 | $1,777 | $11,611 | $3,780 | $7,831 |
| 2016 | $2,331 | $11,611 | $3,780 | $7,831 |
| 2015 | $2,133 | $11,611 | $3,780 | $7,831 |
| 2014 | $1,512 | $8,127 | $3,465 | $4,662 |
| 2013 | -- | $9,614 | $3,465 | $6,149 |
Source: Public Records
Map
Nearby Homes
- 1708 W Steuben St
- 1721 W Steuben St
- 1745 W Steuben St
- 11435 S Davol St
- 11352 S Laflin St
- 11538 S Laflin St
- 11410 S Loomis St
- 11601 S Laflin St
- 11557 S Church St
- 11345 S Ada St
- 11545 S Loomis St
- 11648 S Vincennes Ave
- 11239 S Longwood Dr
- 2010 W 115th St
- 1537 W 110th St
- 11641 S Loomis St
- 11601 S Ada St
- 1416 W 110th Place
- 11116 S Longwood Dr Unit 203
- 11425 S Elizabeth St
- 1707 W Steuben St
- 1715 W Steuben St
- 1703 W Steuben St
- 1719 W Steuben St
- 1701 W Steuben St
- 1714 W Edmaire St
- 1716 W Edmaire St
- 1708 W Edmaire St
- 1722 W Edmaire St
- 1722 W Edmaire St
- 1704 W Edmaire St
- 1728 W Edmaire St
- 1724 W Edmaire St
- 1724 W Edmaire St
- 1700 W Edmaire St
- 1710 W Steuben St
- 1702 W Edmaire St
- 1712 W Steuben St
- 11328 S Davol St
- 11328 S Davol St
Your Personal Tour Guide
Ask me questions while you tour the home.