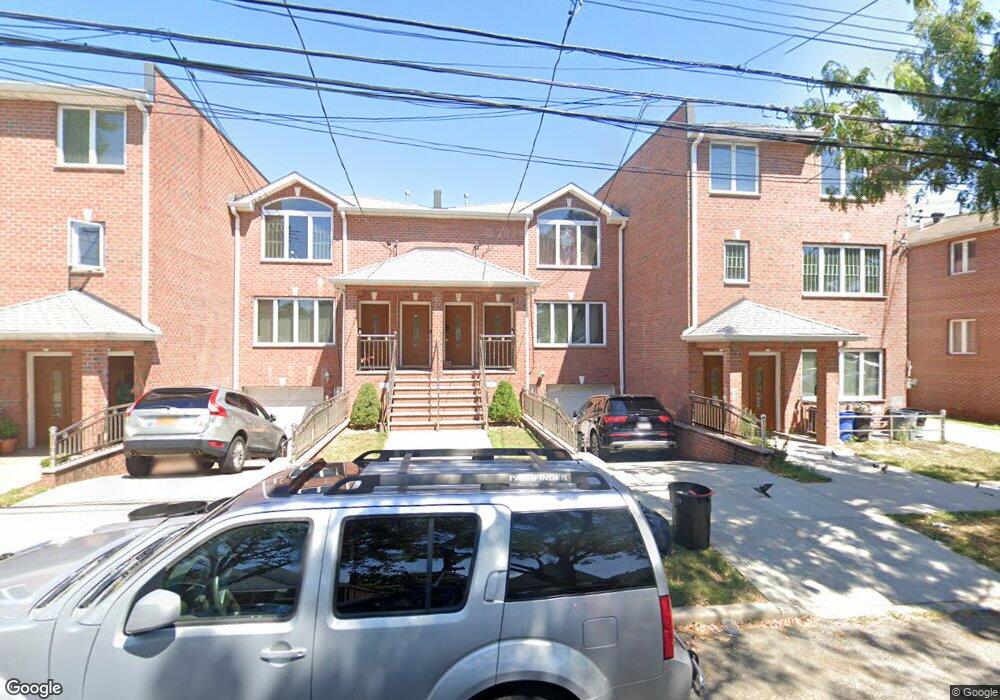
17113 65th Ave Flushing, NY 11365
Fresh Meadows NeighborhoodEstimated Value: $1,356,000 - $1,601,000
Studio
--
Bath
1,806
Sq Ft
$795/Sq Ft
Est. Value
About This Home
This home is located at 17113 65th Ave, Flushing, NY 11365 and is currently estimated at $1,434,911, approximately $794 per square foot. 17113 65th Ave is a home located in Queens County with nearby schools including P.S. 173 - Fresh Meadow, George J. Ryan Middle School 216, and Francis Lewis High School.
Ownership History
Date
Name
Owned For
Owner Type
Purchase Details
Closed on
Aug 21, 2023
Sold by
Estate Of Donna Riccardi and Riccardi Administrator Stephen
Bought by
Riccardi Richard A and Riccardi Stephanie E
Current Estimated Value
Purchase Details
Closed on
Jun 11, 2013
Sold by
A & S Home Builders Llc
Bought by
Riccardi Donna and Riccardi Stephen
Purchase Details
Closed on
Oct 31, 2011
Sold by
Dianne Defelice Revocable Living Trust and Dianne Defelice Trustee
Bought by
A & S Home Builders
Purchase Details
Closed on
May 20, 2009
Sold by
Annamarie Saginario Irrevocable Trust and Dianne Defelice Trustee
Bought by
Dianne Defelice Revocable Living Trust and Dianne Defelice Trustee
Purchase Details
Closed on
Aug 9, 2002
Sold by
Carmen Saginario Deceased and Carmen Saginario Saginario
Bought by
Annamarie Saginario Family Irrevocable T and Dianne Defelice Trustee
Create a Home Valuation Report for This Property
The Home Valuation Report is an in-depth analysis detailing your home's value as well as a comparison with similar homes in the area
Home Values in the Area
Average Home Value in this Area
Purchase History
| Date | Buyer | Sale Price | Title Company |
|---|---|---|---|
| Riccardi Richard A | -- | -- | |
| Riccardi Richard A | -- | -- | |
| Riccardi Richard A | -- | -- | |
| Riccardi Donna | $799,326 | -- | |
| Riccardi Donna | $799,326 | -- | |
| A & S Home Builders | $850,000 | -- | |
| A & S Home Builders | $850,000 | -- | |
| Dianne Defelice Revocable Living Trust | -- | -- | |
| Dianne Defelice Revocable Living Trust | -- | -- | |
| Annamarie Saginario Family Irrevocable T | -- | -- | |
| Annamarie Saginario Family Irrevocable T | -- | -- |
Source: Public Records
Tax History
| Year | Tax Paid | Tax Assessment Tax Assessment Total Assessment is a certain percentage of the fair market value that is determined by local assessors to be the total taxable value of land and additions on the property. | Land | Improvement |
|---|---|---|---|---|
| 2025 | $10,883 | $57,438 | $7,430 | $50,008 |
| 2024 | $10,883 | $54,187 | $8,401 | $45,786 |
| 2023 | $10,382 | $51,120 | $8,119 | $43,001 |
| 2022 | $10,205 | $59,460 | $11,340 | $48,120 |
| 2021 | $10,678 | $57,600 | $11,340 | $46,260 |
| 2020 | $10,132 | $63,300 | $11,340 | $51,960 |
| 2019 | $9,446 | $60,540 | $11,340 | $49,200 |
| 2018 | $8,684 | $42,600 | $11,340 | $31,260 |
| 2017 | $9,106 | $44,671 | $10,514 | $34,157 |
| 2016 | $8,925 | $44,671 | $10,514 | $34,157 |
| 2015 | $3,684 | $43,840 | $11,026 | $32,814 |
| 2014 | $3,684 | $43,143 | $10,773 | $32,370 |
Source: Public Records
Map
Nearby Homes
- 6532 170th St
- 17211 Horace Harding Expy
- 6537 169th St
- 65-11 168th St
- 17508 65th Ave
- 67-07 Fresh Meadow Ln
- 64-04 Utopia Pkwy
- 61-38 167th St
- 65-26 167th St
- 6123 165th St
- 6722 166th St
- 61-31 182nd St
- 166-03 69th Ave
- 70-07 171st St
- 59-32 164th St
- 56-49A Utopia Pkwy
- 182-15 58th Ave Unit A
- 6139 184th St
- 183-26 Booth Memorial Ave
- 7042 173rd St
- 17111 65th Ave
- 17115 65th Ave
- 171-15 65th Ave
- 171-15 65th Ave Unit 3
- 17115 65th Ave Unit 2
- 171-15 65th Ave Unit 2
- 17109 65th Ave
- 6152 172nd St Unit 2Fl
- 6152 172nd St Unit 2Fl
- 61-46 172nd St Unit 2/F
- 61-46 172nd St Unit 1/F
- 6146 172nd St
- 6152 172nd St
- 6142 172nd St
- 17103 65th Ave
- 6143 171st St
- 6143 171st St Unit 2
- 17101 65th Ave
- 6138 172nd St
- 6141 171st St Unit 2FL
Your Personal Tour Guide
Ask me questions while you tour the home.