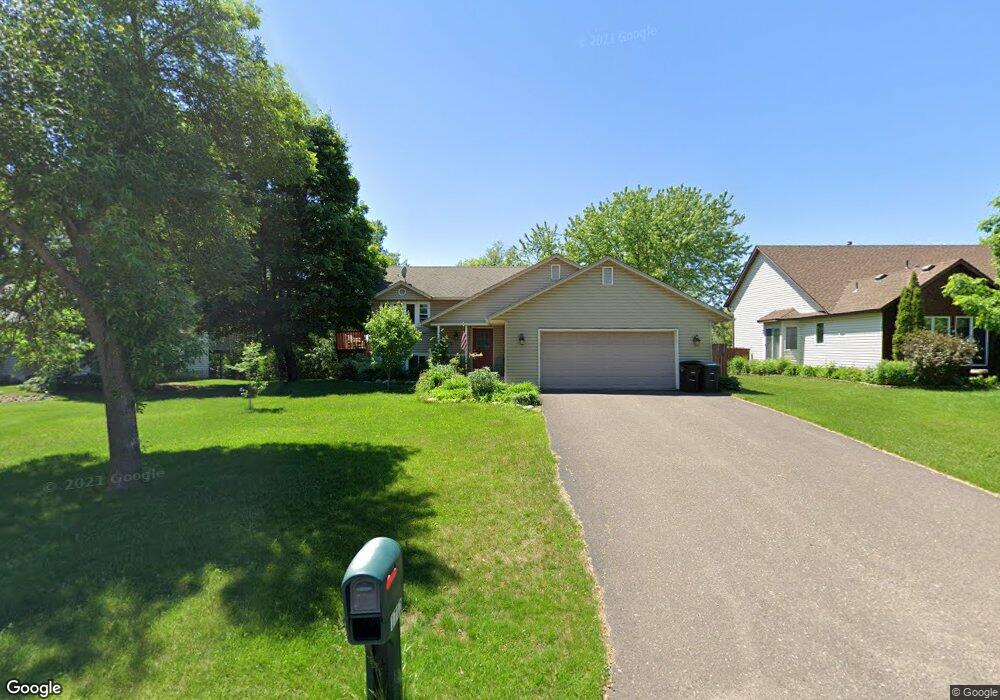
1712 1712 9th-Street-se Forest Lake, MN 55025
Estimated Value: $354,088 - $380,000
3
Beds
2
Baths
972
Sq Ft
$376/Sq Ft
Est. Value
About This Home
This home is located at 1712 1712 9th-Street-se, Forest Lake, MN 55025 and is currently estimated at $365,772, approximately $376 per square foot. 1712 1712 9th-Street-se is a home located in Washington County with nearby schools including Forest Lake Elementary School, Forest Lake Area Middle School, and Forest Lake Area High School.
Ownership History
Date
Name
Owned For
Owner Type
Purchase Details
Closed on
Aug 13, 2025
Sold by
Madson Karisa R
Bought by
Erwin Alexander M
Current Estimated Value
Home Financials for this Owner
Home Financials are based on the most recent Mortgage that was taken out on this home.
Original Mortgage
$337,250
Outstanding Balance
$336,958
Interest Rate
6.72%
Mortgage Type
New Conventional
Estimated Equity
$28,814
Purchase Details
Closed on
May 29, 2015
Sold by
Boorsma Meredith A and Boorsma Matthew J
Bought by
Madson Karisa R
Home Financials for this Owner
Home Financials are based on the most recent Mortgage that was taken out on this home.
Original Mortgage
$212,396
Interest Rate
3.25%
Mortgage Type
FHA
Purchase Details
Closed on
May 26, 2006
Sold by
Dimmerman Carol A
Bought by
Fechter Paul Stephen
Create a Home Valuation Report for This Property
The Home Valuation Report is an in-depth analysis detailing your home's value as well as a comparison with similar homes in the area
Home Values in the Area
Average Home Value in this Area
Purchase History
| Date | Buyer | Sale Price | Title Company |
|---|---|---|---|
| Erwin Alexander M | $370,000 | Results Title | |
| Madson Karisa R | $216,315 | Realstar Title | |
| Fechter Paul Stephen | $225,000 | -- |
Source: Public Records
Mortgage History
| Date | Status | Borrower | Loan Amount |
|---|---|---|---|
| Open | Erwin Alexander M | $337,250 | |
| Previous Owner | Madson Karisa R | $212,396 |
Source: Public Records
Tax History Compared to Growth
Tax History
| Year | Tax Paid | Tax Assessment Tax Assessment Total Assessment is a certain percentage of the fair market value that is determined by local assessors to be the total taxable value of land and additions on the property. | Land | Improvement |
|---|---|---|---|---|
| 2024 | $3,424 | $336,400 | $100,000 | $236,400 |
| 2023 | $3,424 | $323,400 | $97,000 | $226,400 |
| 2022 | $2,674 | $318,000 | $90,000 | $228,000 |
| 2021 | $2,608 | $247,400 | $70,000 | $177,400 |
| 2020 | $2,596 | $238,500 | $70,000 | $168,500 |
| 2019 | $2,616 | $234,000 | $65,000 | $169,000 |
| 2018 | $2,364 | $219,500 | $65,000 | $154,500 |
| 2017 | $2,214 | $219,500 | $75,000 | $144,500 |
| 2016 | $1,916 | $194,700 | $50,000 | $144,700 |
| 2015 | $2,070 | $180,800 | $40,000 | $140,800 |
| 2013 | -- | $146,100 | $40,300 | $105,800 |
Source: Public Records
Map
Nearby Homes
- 1012 18th Ave SE
- 6659 Lipizzan Trail
- 21231 Pasofino Cir N
- 21182 Paint Ln
- 21212 Shetland Dr N
- 21159 Bridle Pass Dr
- 21077 Bridle Pass Dr
- 6609 210th Ln N
- 1008 Bay Dr SE
- 308 8th Ave SE
- 6254 209th St N
- 820 3rd St SE
- 879 17th St SE
- 7447 213th St N
- 255 S Shore Dr
- 6410 207th St N
- 7104 208th Place N
- XXXX N 207th St
- 6389 207th St N
- 21145 Fondant Ave N
- 1706 9th St SE
- 1718 9th St SE
- 1618 9th St SE
- 1724 9th St SE
- 1612 9th St SE
- 1713 9th St SE
- 1707 9th St SE
- 1719 9th St SE
- 1625 9th St SE
- 908 18th Ave SE
- 1606 1606 9th-Street-se
- 1606 9th St SE
- 1619 9th St SE
- 914 18th Ave SE
- 1613 9th St SE
- 1758 10th St SE
- 1776 10th St SE
- 1756 10th St SE
- 1778 10th St SE
- 1778 10th St SE Unit 32