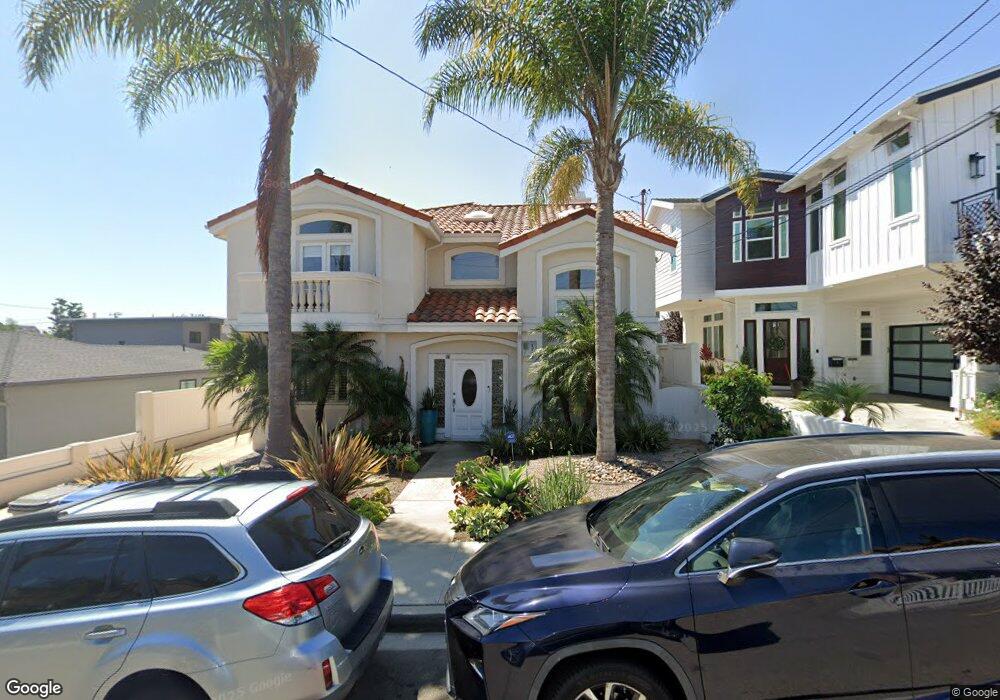
1712 Clark Ln Unit A Redondo Beach, CA 90278
North Redondo Beach NeighborhoodEstimated Value: $1,459,430 - $1,741,000
3
Beds
3
Baths
2,575
Sq Ft
$628/Sq Ft
Est. Value
About This Home
This home is located at 1712 Clark Ln Unit A, Redondo Beach, CA 90278 and is currently estimated at $1,616,608, approximately $627 per square foot. 1712 Clark Ln Unit A is a home located in Los Angeles County with nearby schools including Birney Elementary School, Adams Middle School, and Redondo Union High School.
Ownership History
Date
Name
Owned For
Owner Type
Purchase Details
Closed on
Jan 15, 2015
Sold by
Ban Monty
Bought by
Ban Monty and The Monty Ban Trust
Current Estimated Value
Purchase Details
Closed on
Aug 24, 2012
Sold by
Castillo Nelsy Y
Bought by
Ban Monty
Home Financials for this Owner
Home Financials are based on the most recent Mortgage that was taken out on this home.
Original Mortgage
$284,000
Outstanding Balance
$195,069
Interest Rate
3.49%
Mortgage Type
New Conventional
Estimated Equity
$1,421,539
Purchase Details
Closed on
Aug 23, 2002
Sold by
Carreras Neisy and Ban Monty
Bought by
Ban Monty
Home Financials for this Owner
Home Financials are based on the most recent Mortgage that was taken out on this home.
Original Mortgage
$295,000
Interest Rate
5.12%
Purchase Details
Closed on
Nov 6, 1998
Sold by
Mark Lacharite & Sons Construction Inc
Bought by
Ban Monty
Home Financials for this Owner
Home Financials are based on the most recent Mortgage that was taken out on this home.
Original Mortgage
$300,000
Interest Rate
6.75%
Create a Home Valuation Report for This Property
The Home Valuation Report is an in-depth analysis detailing your home's value as well as a comparison with similar homes in the area
Home Values in the Area
Average Home Value in this Area
Purchase History
| Date | Buyer | Sale Price | Title Company |
|---|---|---|---|
| Ban Monty | -- | None Available | |
| Ban Monty | -- | Lawyers Title Company | |
| Ban Monty | -- | Fidelity Title | |
| Ban Monty | $440,000 | Lawyers Title Company |
Source: Public Records
Mortgage History
| Date | Status | Borrower | Loan Amount |
|---|---|---|---|
| Open | Ban Monty | $284,000 | |
| Closed | Ban Monty | $295,000 | |
| Closed | Ban Monty | $300,000 |
Source: Public Records
Tax History
| Year | Tax Paid | Tax Assessment Tax Assessment Total Assessment is a certain percentage of the fair market value that is determined by local assessors to be the total taxable value of land and additions on the property. | Land | Improvement |
|---|---|---|---|---|
| 2025 | $8,363 | $689,773 | $297,854 | $391,919 |
| 2024 | $8,363 | $676,249 | $292,014 | $384,235 |
| 2023 | $8,216 | $662,990 | $286,289 | $376,701 |
| 2022 | $8,064 | $649,991 | $280,676 | $369,315 |
| 2021 | $7,836 | $637,247 | $275,173 | $362,074 |
| 2019 | $7,643 | $618,348 | $267,012 | $351,336 |
| 2018 | $7,400 | $606,225 | $261,777 | $344,448 |
| 2016 | $7,144 | $582,687 | $251,613 | $331,074 |
| 2015 | $7,017 | $573,935 | $247,834 | $326,101 |
| 2014 | $6,917 | $562,694 | $242,980 | $319,714 |
Source: Public Records
Map
Nearby Homes
- 1707 Marshallfield Ln Unit A
- 1707 Marshallfield Ln Unit B
- 1216 Steinhart Ave
- 1729 Harriman Ln Unit A
- 1113 Ford Ave
- 1114 Goodman Ave
- 1710 Grant Ave Unit 15
- 1409 Goodman Ave
- 1717 Grant Ave
- 1511 Goodman Ave
- 1626 Wollacott St
- 1911 Speyer Ln Unit A
- 1914 Belmont Ln Unit A
- 1914 Belmont Ln Unit B
- 1213 14th St
- 1723 Havemeyer Ln
- 1306 Corona St
- 1646 Havemeyer Ln
- 1911 Rockefeller Ln Unit E
- 1133 8th St
- 1712 Clark Ln
- 1712 Clark Ln Unit B
- 1710 Clark Ln Unit A
- 1710 Clark Ln Unit B
- 1710 Clark Ln
- 1714 Clark Ln
- 1708 Clark Ln Unit B
- 1708 Clark Ln Unit A
- 1716 Clark Ln
- 1711 Marshallfield Ln Unit B
- 1711 Marshallfield Ln Unit A
- 1725 Clark Ln
- 1706 Clark Ln Unit B
- 1706 Clark Ln Unit A
- 1709 Marshallfield Ln Unit D
- 1709 Marshallfield Ln Unit C
- 1709 Marshallfield Ln Unit B
- 1709 Marshallfield Ln Unit A
- 1718 Clark Ln Unit B
- 1718 Clark Ln Unit A
Your Personal Tour Guide
Ask me questions while you tour the home.