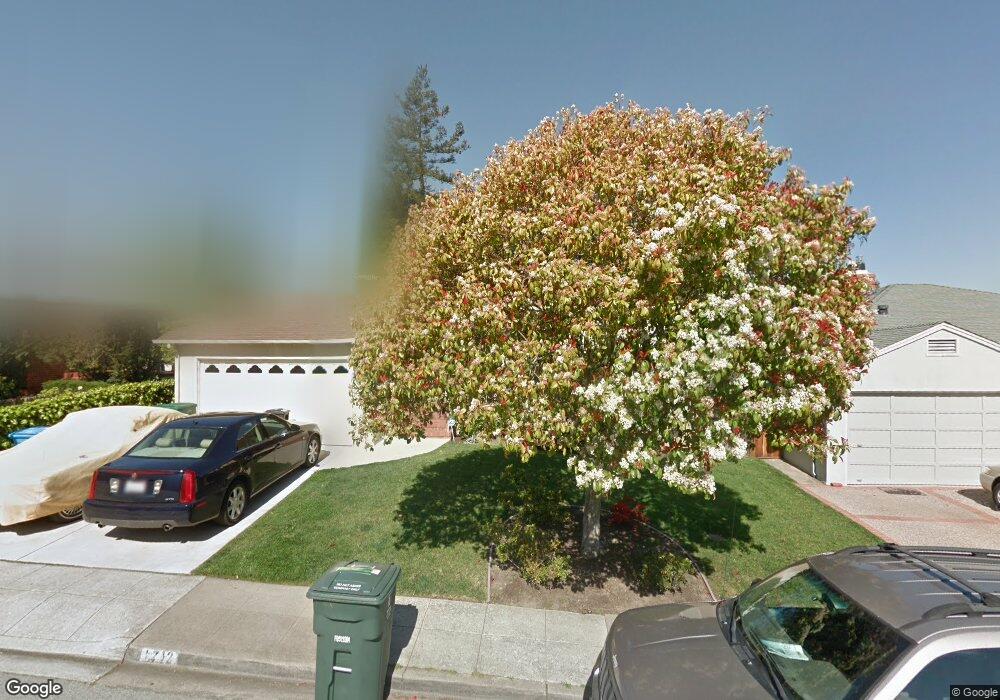
1712 Devereux Dr Burlingame, CA 94010
Ray Park NeighborhoodEstimated Value: $2,533,000 - $3,140,000
3
Beds
3
Baths
1,685
Sq Ft
$1,694/Sq Ft
Est. Value
About This Home
This home is located at 1712 Devereux Dr, Burlingame, CA 94010 and is currently estimated at $2,854,542, approximately $1,694 per square foot. 1712 Devereux Dr is a home located in San Mateo County with nearby schools including Lincoln Elementary School, Burlingame Intermediate School, and Burlingame High School.
Ownership History
Date
Name
Owned For
Owner Type
Purchase Details
Closed on
Nov 1, 2012
Sold by
Kaldis Alex
Bought by
Chan Chang Ching and Liu Ying
Current Estimated Value
Home Financials for this Owner
Home Financials are based on the most recent Mortgage that was taken out on this home.
Original Mortgage
$600,000
Outstanding Balance
$415,396
Interest Rate
3.43%
Mortgage Type
New Conventional
Estimated Equity
$2,439,146
Purchase Details
Closed on
Jul 12, 2012
Sold by
Dust Laura M
Bought by
Kaldis Alex
Home Financials for this Owner
Home Financials are based on the most recent Mortgage that was taken out on this home.
Original Mortgage
$569,500
Interest Rate
3.7%
Mortgage Type
Seller Take Back
Purchase Details
Closed on
Oct 14, 2004
Sold by
Corey Charles E and Corey Frances P
Bought by
Corey Charles E and Corey Frances P
Create a Home Valuation Report for This Property
The Home Valuation Report is an in-depth analysis detailing your home's value as well as a comparison with similar homes in the area
Home Values in the Area
Average Home Value in this Area
Purchase History
| Date | Buyer | Sale Price | Title Company |
|---|---|---|---|
| Chan Chang Ching | $1,450,000 | Fidelity National Title Co | |
| Kaldis Alex | $850,000 | Fidelity National Title Co | |
| Corey Charles E | -- | -- |
Source: Public Records
Mortgage History
| Date | Status | Borrower | Loan Amount |
|---|---|---|---|
| Open | Chan Chang Ching | $600,000 | |
| Previous Owner | Kaldis Alex | $569,500 |
Source: Public Records
Tax History Compared to Growth
Tax History
| Year | Tax Paid | Tax Assessment Tax Assessment Total Assessment is a certain percentage of the fair market value that is determined by local assessors to be the total taxable value of land and additions on the property. | Land | Improvement |
|---|---|---|---|---|
| 2025 | $20,012 | $1,785,560 | $892,780 | $892,780 |
| 2023 | $20,012 | $1,716,226 | $858,113 | $858,113 |
| 2022 | $19,301 | $1,682,576 | $841,288 | $841,288 |
| 2021 | $19,328 | $1,649,586 | $824,793 | $824,793 |
| 2020 | $18,928 | $1,632,672 | $816,336 | $816,336 |
| 2019 | $18,508 | $1,600,660 | $800,330 | $800,330 |
| 2018 | $18,157 | $1,569,276 | $784,638 | $784,638 |
| 2017 | $18,025 | $1,538,506 | $769,253 | $769,253 |
| 2016 | $17,363 | $1,508,340 | $754,170 | $754,170 |
| 2015 | $17,287 | $1,485,684 | $742,842 | $742,842 |
| 2014 | $17,036 | $1,456,582 | $728,291 | $728,291 |
Source: Public Records
Map
Nearby Homes
- 1568 Columbus Ave
- 1421 El Camino Real Unit 6
- 1431 Laguna Ave
- 1838 Ogden Dr Unit 413
- 1425 Castillo Ave
- 1325 Paloma Ave
- 1300 Paloma Ave
- 2301 Easton Dr
- 1237 Capuchino Ave Unit 7
- 1500 Broadway Unit 205
- 1217 Paloma Ave Unit 3
- 88 S Broadway Unit 2101
- 2700 Mariposa Dr
- 1137 Paloma Ave Unit E
- 100 Millbrae Ave
- 8 Reynolds Ct
- 2912 Hillside Dr
- 1115 Capuchino Ave
- 1111 Laguna Ave
- 151 El Camino Real None Unit 402