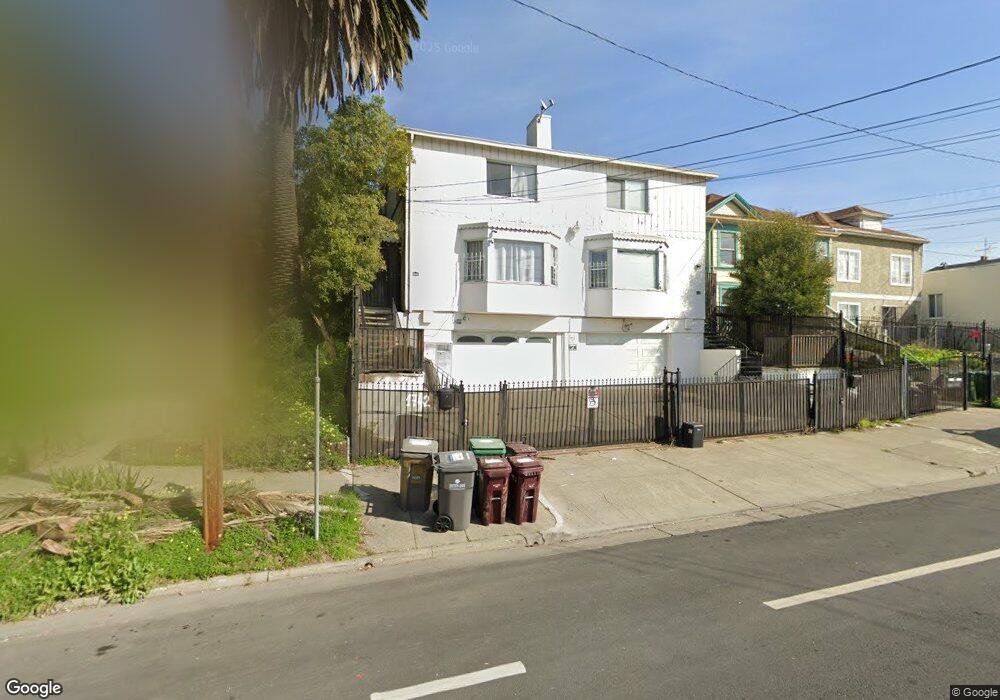
1712 E 21st St Oakland, CA 94606
Highland Terrace NeighborhoodEstimated Value: $765,000 - $1,094,000
4
Beds
3
Baths
2,860
Sq Ft
$320/Sq Ft
Est. Value
About This Home
This home is located at 1712 E 21st St, Oakland, CA 94606 and is currently estimated at $916,460, approximately $320 per square foot. 1712 E 21st St is a home located in Alameda County with nearby schools including Garfield Elementary School, Roosevelt Middle School, and Oakland High School.
Ownership History
Date
Name
Owned For
Owner Type
Purchase Details
Closed on
Dec 15, 2025
Sold by
Peak Foreclosure Services Inc
Bought by
Lawrence M Neal Revocable Living Trust and David Lawrence Dold Revocable Trust
Current Estimated Value
Purchase Details
Closed on
Jan 22, 2010
Sold by
Luc Phuong N and Do Dai X
Bought by
Luc Phuong N and Nguyen Whitney L
Purchase Details
Closed on
Oct 26, 2004
Sold by
Pham Truc Ba
Bought by
Luc Phuong N and Do Dai X
Home Financials for this Owner
Home Financials are based on the most recent Mortgage that was taken out on this home.
Original Mortgage
$427,000
Interest Rate
5.74%
Mortgage Type
Purchase Money Mortgage
Create a Home Valuation Report for This Property
The Home Valuation Report is an in-depth analysis detailing your home's value as well as a comparison with similar homes in the area
Home Values in the Area
Average Home Value in this Area
Purchase History
| Date | Buyer | Sale Price | Title Company |
|---|---|---|---|
| Lawrence M Neal Revocable Living Trust | $340,913 | Wfg National Title | |
| Luc Phuong N | -- | None Available | |
| Luc Phuong N | $570,000 | Commonwealth Land Title Co |
Source: Public Records
Mortgage History
| Date | Status | Borrower | Loan Amount |
|---|---|---|---|
| Previous Owner | Luc Phuong N | $427,000 | |
| Closed | Luc Phuong N | $29,000 |
Source: Public Records
Tax History
| Year | Tax Paid | Tax Assessment Tax Assessment Total Assessment is a certain percentage of the fair market value that is determined by local assessors to be the total taxable value of land and additions on the property. | Land | Improvement |
|---|---|---|---|---|
| 2025 | $12,324 | $691,421 | $207,426 | $483,995 |
| 2024 | $12,324 | $677,867 | $203,360 | $474,507 |
| 2023 | $12,452 | $664,578 | $199,373 | $465,205 |
| 2022 | $11,039 | $651,550 | $195,465 | $456,085 |
| 2021 | $10,501 | $638,777 | $191,633 | $447,144 |
| 2020 | $10,385 | $632,228 | $189,668 | $442,560 |
| 2019 | $9,960 | $619,837 | $185,951 | $433,886 |
| 2018 | $9,753 | $607,687 | $182,306 | $425,381 |
| 2017 | $9,365 | $595,776 | $178,733 | $417,043 |
| 2016 | $9,072 | $584,097 | $175,229 | $408,868 |
| 2015 | $9,025 | $575,326 | $172,598 | $402,728 |
| 2014 | $9,241 | $564,058 | $169,217 | $394,841 |
Source: Public Records
Map
Nearby Homes
Your Personal Tour Guide
Ask me questions while you tour the home.