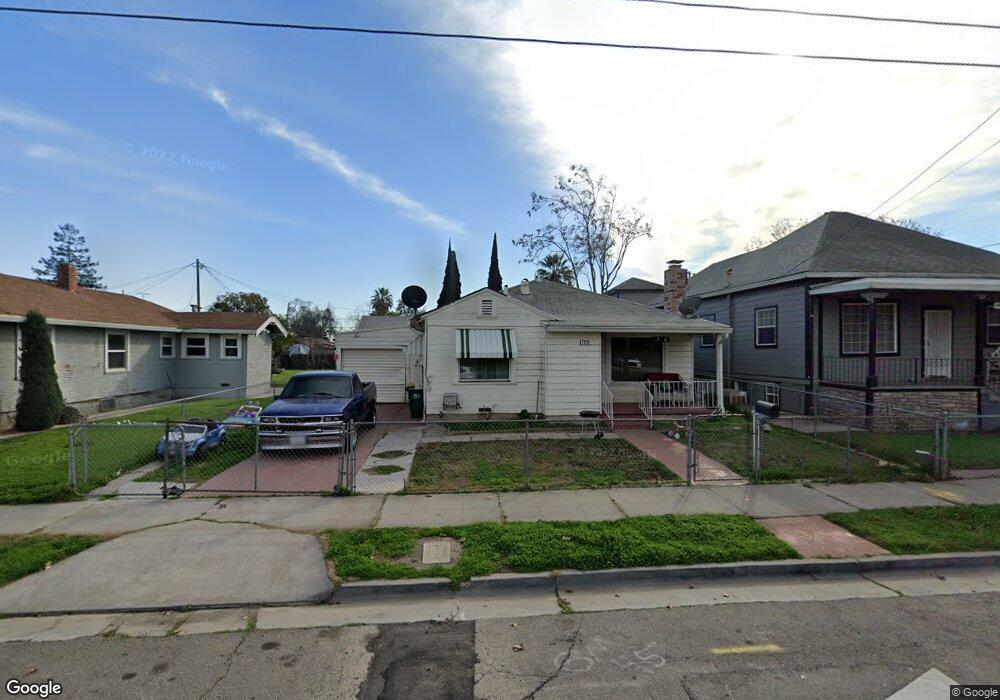
1712 E Lafayette St Stockton, CA 95205
East Stockton NeighborhoodEstimated Value: $275,000 - $297,358
2
Beds
1
Bath
1,154
Sq Ft
$248/Sq Ft
Est. Value
About This Home
This home is located at 1712 E Lafayette St, Stockton, CA 95205 and is currently estimated at $286,340, approximately $248 per square foot. 1712 E Lafayette St is a home located in San Joaquin County with nearby schools including King Elementary School, Roosevelt Elementary School, and John C. Fremont Elementary School.
Ownership History
Date
Name
Owned For
Owner Type
Purchase Details
Closed on
May 13, 2021
Sold by
Lurtsema Real Estate Llc
Bought by
Ncd Investments Llc
Current Estimated Value
Home Financials for this Owner
Home Financials are based on the most recent Mortgage that was taken out on this home.
Original Mortgage
$5,849,500
Outstanding Balance
$5,284,444
Interest Rate
2.9%
Mortgage Type
New Conventional
Estimated Equity
-$4,998,104
Purchase Details
Closed on
Feb 16, 2011
Sold by
Rodriguez Alicia Luz
Bought by
Lurtsema Real Estate Llc
Purchase Details
Closed on
Feb 22, 2008
Sold by
Cooper Lucille and Spalinger Cathy
Bought by
Rodriguez Alicia Luz
Home Financials for this Owner
Home Financials are based on the most recent Mortgage that was taken out on this home.
Original Mortgage
$162,701
Interest Rate
5.64%
Mortgage Type
FHA
Purchase Details
Closed on
Aug 12, 1999
Sold by
Cress Helen
Bought by
Cress Helen and Helen Cress Revocable Trust
Create a Home Valuation Report for This Property
The Home Valuation Report is an in-depth analysis detailing your home's value as well as a comparison with similar homes in the area
Home Values in the Area
Average Home Value in this Area
Purchase History
| Date | Buyer | Sale Price | Title Company |
|---|---|---|---|
| Ncd Investments Llc | -- | None Listed On Document | |
| Lurtsema Real Estate Llc | $38,000 | Chicago Title Company | |
| Rodriguez Alicia Luz | $165,000 | Chicago Title Company | |
| Cress Helen | -- | -- |
Source: Public Records
Mortgage History
| Date | Status | Borrower | Loan Amount |
|---|---|---|---|
| Open | Ncd Investments Llc | $5,849,500 | |
| Previous Owner | Rodriguez Alicia Luz | $162,701 |
Source: Public Records
Tax History
| Year | Tax Paid | Tax Assessment Tax Assessment Total Assessment is a certain percentage of the fair market value that is determined by local assessors to be the total taxable value of land and additions on the property. | Land | Improvement |
|---|---|---|---|---|
| 2025 | $654 | $48,547 | $11,527 | $37,020 |
| 2024 | $643 | $47,596 | $11,301 | $36,295 |
| 2023 | $629 | $46,664 | $11,080 | $35,584 |
| 2022 | $594 | $45,750 | $10,863 | $34,887 |
| 2021 | $571 | $44,853 | $10,650 | $34,203 |
| 2020 | $582 | $44,394 | $10,541 | $33,853 |
| 2019 | $579 | $43,525 | $10,335 | $33,190 |
| 2018 | $569 | $42,673 | $10,133 | $32,540 |
| 2017 | $540 | $41,837 | $9,935 | $31,902 |
| 2016 | $549 | $41,017 | $9,740 | $31,277 |
| 2015 | $548 | $40,401 | $9,594 | $30,807 |
| 2014 | $524 | $39,610 | $9,406 | $30,204 |
Source: Public Records
Map
Nearby Homes
- 2006 E Lafayette St
- 336 S Airport Way
- 29 S Sierra Nevada St
- 1224 E Lafayette St
- 1237 E Hazelton Ave
- 1211 E Main St
- 1123 E Washington St
- 1636 E Anderson St
- 2217 E Hazelton Ave
- 835 S Airport Way
- 832 S Pilgrim St
- 1200 E Miner Ave
- 2362 Alma St
- 2368 E Weber Ave
- 0 Park Unit SR25247647
- 2387 E Lafayette St
- 709 E Sonora St
- 2415 E Taylor St
- 921 S Aurora St
- 644 N Airport Way
- 1706 E Lafayette St
- 1718 E Lafayette St
- 320 S Della St
- 1730 E Lafayette St
- 330 S Della St
- 1725 E Lafayette St
- 1734 E Lafayette St
- 336 S Della St
- 1723 E Sonora St
- 303 S Della St
- 309 S Della St
- 1725 E Sonora St
- 1735 E Lafayette St
- 1742 E Lafayette St
- 317 S Della St
- 344 S Della St
- 1729 E Sonora St
- 1743 E Lafayette St
- 1620 E Lafayette St
- 327 S Della St
Your Personal Tour Guide
Ask me questions while you tour the home.