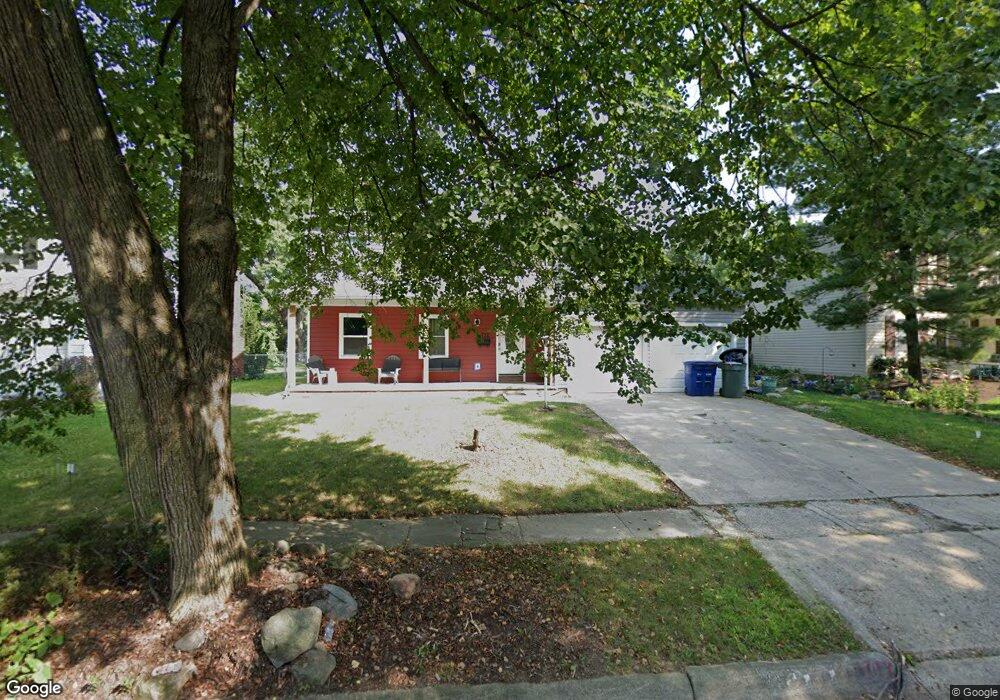
1712 Peardale Rd N Columbus, OH 43229
Northgate NeighborhoodEstimated Value: $314,000 - $378,000
4
Beds
3
Baths
2,016
Sq Ft
$165/Sq Ft
Est. Value
About This Home
This home is located at 1712 Peardale Rd N, Columbus, OH 43229 and is currently estimated at $333,516, approximately $165 per square foot. 1712 Peardale Rd N is a home located in Franklin County with nearby schools including Alpine Elementary School, Northgate Intermediate, and Woodward Park Middle School.
Ownership History
Date
Name
Owned For
Owner Type
Purchase Details
Closed on
Apr 12, 2010
Sold by
Gomez Omar
Bought by
Vergara Maria I
Current Estimated Value
Purchase Details
Closed on
May 23, 2008
Sold by
Bucy S and 1712 Peardale Road Residential
Bought by
Gomez Omar and Vergara Maria I
Home Financials for this Owner
Home Financials are based on the most recent Mortgage that was taken out on this home.
Original Mortgage
$125,860
Interest Rate
6.01%
Mortgage Type
FHA
Purchase Details
Closed on
Sep 14, 2005
Sold by
Cain Geraldine M and The Geraldine M Cain Revocable
Bought by
Clark Daniel J and Clark Kerri J
Home Financials for this Owner
Home Financials are based on the most recent Mortgage that was taken out on this home.
Original Mortgage
$33,800
Interest Rate
5.55%
Mortgage Type
Stand Alone Second
Purchase Details
Closed on
Mar 18, 1998
Sold by
Cain William and Cain Geraldine M
Bought by
Cain Geraldine M and Geraldine M Cain Revocable Tru
Create a Home Valuation Report for This Property
The Home Valuation Report is an in-depth analysis detailing your home's value as well as a comparison with similar homes in the area
Home Values in the Area
Average Home Value in this Area
Purchase History
| Date | Buyer | Sale Price | Title Company |
|---|---|---|---|
| Vergara Maria I | $85,900 | None Available | |
| Gomez Omar | $126,900 | Hostetler | |
| Clark Daniel J | $169,000 | Lawyers Tit | |
| Cain Geraldine M | -- | -- |
Source: Public Records
Mortgage History
| Date | Status | Borrower | Loan Amount |
|---|---|---|---|
| Previous Owner | Gomez Omar | $125,860 | |
| Previous Owner | Clark Daniel J | $33,800 |
Source: Public Records
Tax History Compared to Growth
Tax History
| Year | Tax Paid | Tax Assessment Tax Assessment Total Assessment is a certain percentage of the fair market value that is determined by local assessors to be the total taxable value of land and additions on the property. | Land | Improvement |
|---|---|---|---|---|
| 2024 | $4,746 | $105,740 | $21,420 | $84,320 |
| 2023 | $4,685 | $105,735 | $21,420 | $84,315 |
| 2022 | $3,827 | $73,780 | $13,930 | $59,850 |
| 2021 | $3,641 | $70,070 | $13,930 | $56,140 |
| 2020 | $3,716 | $70,560 | $13,930 | $56,630 |
| 2019 | $3,418 | $56,350 | $11,130 | $45,220 |
| 2018 | $3,052 | $56,350 | $11,130 | $45,220 |
| 2017 | $3,191 | $56,350 | $11,130 | $45,220 |
| 2016 | $2,966 | $44,770 | $8,440 | $36,330 |
| 2015 | $2,692 | $44,770 | $8,440 | $36,330 |
| 2014 | $2,699 | $44,770 | $8,440 | $36,330 |
| 2013 | $1,479 | $49,735 | $9,380 | $40,355 |
Source: Public Records
Map
Nearby Homes
- 6407 Skywae Dr
- 1635 Tendril Ct
- 6458 Faircrest Rd
- 6342 Bellmeadow Dr
- 6407 Faircrest Rd
- 1755 Hillandale Ave
- 6355 Johnanne St
- 6496 Hearthstone Ave
- 1421 Bosworth Place
- 6245 Sharon Woods Blvd
- 1409 Bosworth Place
- 6448 Sharon Woods Blvd Unit B
- 1549 Alpine Dr
- 2120 Willowick Dr Unit B
- 1322 Bolenhill Ct
- 1294 Clydesdale Ct
- 1268 Kildale Ct
- 6019 Beechcroft Rd
- 6658 Walbridge St
- 6035 Karl Rd
- 1704 Peardale Rd N
- 1722 Peardale Rd N
- 1711 Calgary Dr
- 1694 Peardale Rd N
- 1719 Calgary Dr
- 1703 Calgary Dr
- 1728 Peardale Rd N
- 1727 Calgary Dr
- 1717 Peardale Rd N
- 1707 Peardale Rd N
- 1693 Calgary Dr
- 1686 Peardale Rd N
- 1719 Peardale Rd N
- 1697 Peardale Rd N
- 1734 Peardale Rd N
- 1685 Calgary Dr
- 6487 Skywae Dr
- 1678 Peardale Rd N
- 6435 Peardale Rd E
- 6475 Skywae Dr