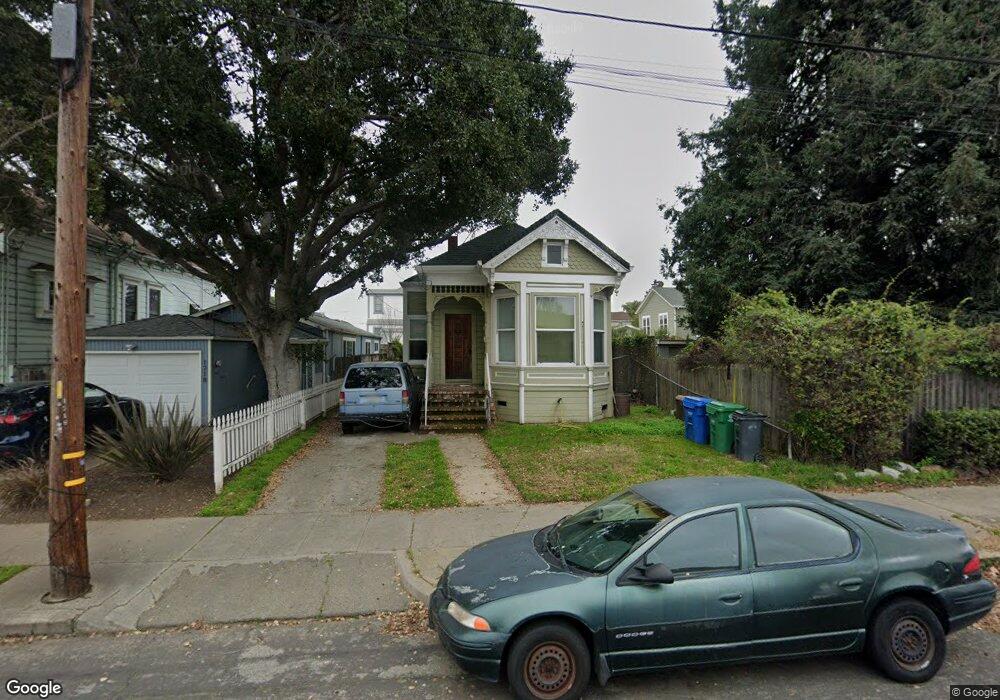
1712 Schiller St Alameda, CA 94501
West Alameda NeighborhoodEstimated Value: $702,000 - $873,623
2
Beds
1
Bath
1,088
Sq Ft
$689/Sq Ft
Est. Value
About This Home
This home is located at 1712 Schiller St, Alameda, CA 94501 and is currently estimated at $750,156, approximately $689 per square foot. 1712 Schiller St is a home located in Alameda County with nearby schools including Love Elementary, Will C. Wood Middle School, and Alameda High School.
Ownership History
Date
Name
Owned For
Owner Type
Purchase Details
Closed on
Jun 26, 2025
Sold by
Zca Homes Llc
Bought by
Sunday Estate Llc
Current Estimated Value
Home Financials for this Owner
Home Financials are based on the most recent Mortgage that was taken out on this home.
Original Mortgage
$710,000
Outstanding Balance
$708,195
Interest Rate
6.86%
Mortgage Type
New Conventional
Estimated Equity
$41,961
Purchase Details
Closed on
Jan 25, 2021
Sold by
Williams Ronald R and Williams Ronald Roy
Bought by
Williams David Francis and Williams Ronald Roy
Purchase Details
Closed on
Jan 20, 1994
Sold by
Vandecaveye George R
Bought by
Williams Vandecaveye Eleanor M and Williams Eleanor M
Home Financials for this Owner
Home Financials are based on the most recent Mortgage that was taken out on this home.
Original Mortgage
$83,537
Interest Rate
7.1%
Create a Home Valuation Report for This Property
The Home Valuation Report is an in-depth analysis detailing your home's value as well as a comparison with similar homes in the area
Home Values in the Area
Average Home Value in this Area
Purchase History
| Date | Buyer | Sale Price | Title Company |
|---|---|---|---|
| Sunday Estate Llc | $710,000 | Wfg National Title Insurance C | |
| Zca Homes Llc | $620,000 | Wfg National Title Insurance C | |
| Williams David Francis | -- | None Available | |
| Williams Vandecaveye Eleanor M | -- | First American Title |
Source: Public Records
Mortgage History
| Date | Status | Borrower | Loan Amount |
|---|---|---|---|
| Open | Sunday Estate Llc | $710,000 | |
| Previous Owner | Williams Vandecaveye Eleanor M | $83,537 |
Source: Public Records
Tax History
| Year | Tax Paid | Tax Assessment Tax Assessment Total Assessment is a certain percentage of the fair market value that is determined by local assessors to be the total taxable value of land and additions on the property. | Land | Improvement |
|---|---|---|---|---|
| 2025 | $3,915 | $228,379 | $79,654 | $155,725 |
| 2024 | $3,915 | $223,765 | $78,093 | $152,672 |
| 2023 | $3,768 | $226,240 | $76,562 | $149,678 |
| 2022 | $3,677 | $214,803 | $75,060 | $146,743 |
| 2021 | $3,585 | $210,455 | $73,589 | $143,866 |
| 2020 | $3,535 | $215,226 | $72,834 | $142,392 |
| 2019 | $3,434 | $211,006 | $71,406 | $139,600 |
| 2018 | $3,348 | $206,869 | $70,006 | $136,863 |
| 2017 | $3,557 | $202,814 | $68,634 | $134,180 |
| 2016 | $3,541 | $198,837 | $67,288 | $131,549 |
| 2015 | $3,523 | $195,852 | $66,278 | $129,574 |
| 2014 | $3,393 | $192,016 | $64,980 | $127,036 |
Source: Public Records
Map
Nearby Homes
- 1707 Lincoln Ave
- 1821 Grand St
- 1933 Grand St
- 1937 Grand St
- 1670 Larkspur St
- 1660 Clement Ave
- 2025 Stanford St
- 2053 Clement Ave
- 2256 Stanford St
- 2358 Stanford St
- 2050 Central Ave
- 2136 Pacific Ave
- 1401 Cottage St Unit D
- 610 Grand St
- 1211 Paru St
- 2118 Alameda Ave
- 1500 Alameda Ave Unit G
- 1606 Morton St
- 1203 Benton St
- 1217 Lincoln Ave
- 1722 Schiller St
- 1825 Pacific Ave
- 1823 Pacific Ave - 1823 Pacific Ave
- 1827 Pacific Ave
- 1823 Pacific Ave Unit A
- 1823 Pacific Ave Unit C
- 1823 Pacific Ave
- 1713 Lafayette St
- 1828 Buena Vista Ave
- 1728 Schiller St
- 1709 Lafayette St
- 1719 Lafayette St
- 1707 Lafayette St
- 1715 Schiller St
- 1723 Lafayette St
- 1711 Schiller St
- 1831 Pacific Ave
- 1707 Schiller St
- 1725 Lafayette St
- 1721 Schiller St
Your Personal Tour Guide
Ask me questions while you tour the home.