NOT LISTED FOR SALE

1712 Sewell Cir Perry, GA 31069

Estimated Value: $126,000 - $228,000

3 Beds
2 Baths
1,254 Sq Ft
$125/Sq Ft Est. Value

About This Home

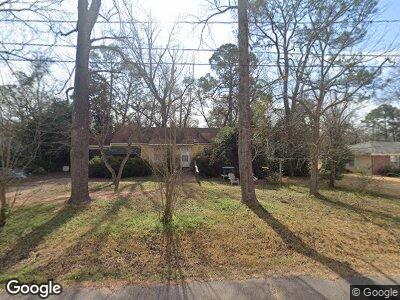
This home is located at 1712 Sewell Cir, Perry, GA 31069 and is currently estimated at $156,522, approximately $124 per square foot. 1712 Sewell Cir is a home located in Houston County with nearby schools including Morningside Elementary School, Perry Middle School, and Perry High School.

Ownership History

Date Name Owned For Owner Type

Purchase Details

Closed on
Dec 6, 2022
Sold by
Robins Federal Credit Union
Bought by
Ratchford & Hart Homes Llc
Current Estimated Value
$156,522

Home Financials for this Owner

Home Financials are based on the most recent Mortgage that was taken out on this home.
Original Mortgage
$113,000
Interest Rate
6.49%
Mortgage Type
New Conventional

Purchase Details

Closed on
Feb 26, 1993
Sold by
Crawford Joe F and Claire Anne
Bought by
George David R

Purchase Details

Closed on
Jul 20, 1979
Sold by
Mullis John R and Mullis Patricia B
Bought by
Crawford Joe F and Claire Anne

Purchase Details

Closed on
Feb 17, 1967
Bought by
Mullis John R and Mullis Patricia B

Purchase Details

Closed on
Aug 9, 1965
Sold by
Olney Roy H
Bought by
Proctor Trust Co

Purchase Details

Closed on
Jun 12, 1962
Bought by
Olney Roy H

Range of Values:

Collateral Analytics

Collateral Analytics Collateral Analytics AVMs (Automated Valuation Model) employ a number of statistical approaches combined with neighborhood-specific comparable selection guarantees the most up-to-date and precise valuations.

Not Available

Collateral Analytics does not have data for the current month. Please view the chart for historical values.

ICE

ICE Mortgage Technology ICE Mortgage Technology’s AVM (Automated Valuation Model) is a state-of-the-art online residential property valuation tool that provides a quick and accurate estimate of the value of almost any home in the U.S.

Not Available

ICE Mortgage Technology does not have data for the current month. Please view the chart for historical values.

First American

First American First American Data & Analytics’ next-generation AVM combines unrivaled data assets with a blended ensemble of valuation models to produce highly accurate, reliable valuations you can trust.

Not Available

First American does not have data for the current month. Please view the chart for historical values.

Quantarium

Quantarium Quantarium’s valuation service, repeatedly proven the industry’s most accurate and comprehensive, is supercharged with a self-learning and auto-tuning AI engine that continually becomes smarter and more accurate as it processes daily inputs from the industry’s leading RE data lake.

Not Available

Quantarium does not have data for the current month. Please view the chart for historical values.

Average Value
Not Available
List Price
Sold Price
Create a Home Valuation Report for This Property
The Home Valuation Report is an in-depth analysis detailing your home's value as well as a comparison with similar homes in the area

Home Values in the Area

Source: Public Records

Average Home Value in this Area


Source: Public Records

Purchase History

Date Buyer Sale Price Title Company
Ratchford & Hart Homes Llc $48,000 --
George David R $33,000 --
Crawford Joe F -- --
Mullis John R -- --
Proctor Trust Co -- --
Olney Roy H -- --
Source: Public Records

Mortgage History

Date Status Borrower Loan Amount
Closed Ratchford & Hart Homes Llc $113,000
Previous Owner George David R $57,000
Source: Public Records

Property History

Date Event Price Change Sq Ft Price
11/17/2023 11/17/23 Rented $1,550 0.0% --
10/27/2023 10/27/23 For Rent $1,550 -- --

Tax History Compared to Growth

Source: Public Records

Tax History

Year Tax Paid Tax Assessment Tax Assessment Total Assessment is a certain percentage of the fair market value that is determined by local assessors to be the total taxable value of land and additions on the property. Land Improvement
2024 $1,213 $33,000 $4,280 $28,720
2023 $1,021 $27,600 $4,280 $23,320
2022 $544 $25,680 $4,280 $21,400
2021 $493 $23,320 $4,280 $19,040
2020 $478 $22,560 $4,280 $18,280
2019 $478 $22,560 $4,280 $18,280
2018 $478 $22,560 $4,280 $18,280
2017 $478 $22,560 $4,280 $18,280
2016 $479 $22,560 $4,280 $18,280
2015 $480 $22,560 $4,280 $18,280
2014 -- $22,560 $4,280 $18,280
2013 -- $22,560 $4,280 $18,280
Source: Public Records

Agents Affiliated with this Home

  • Section Image
See All Agents

Map