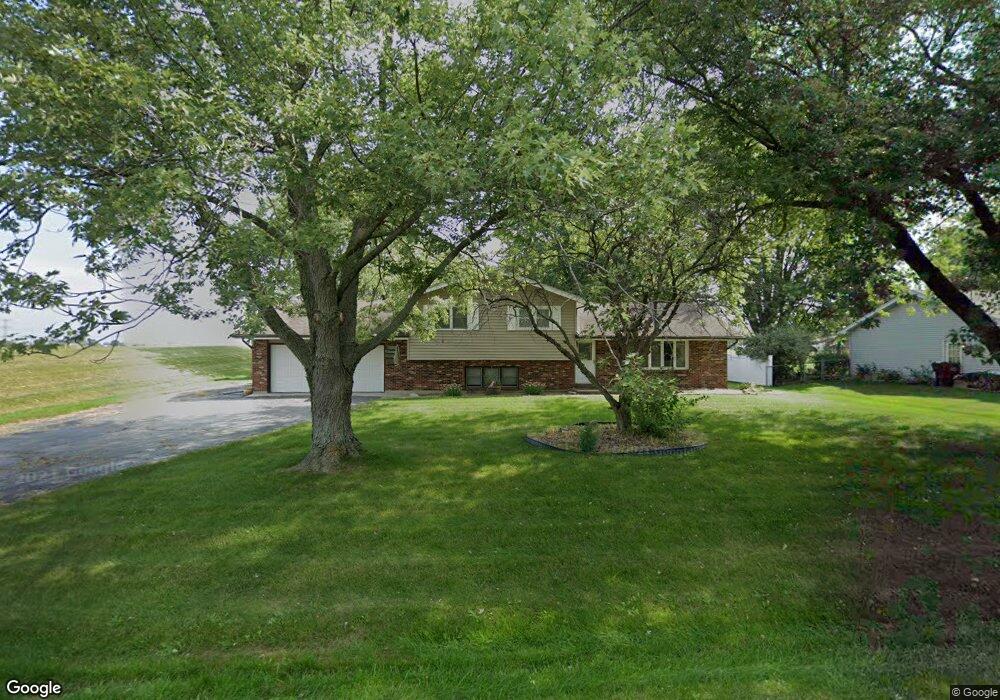
1712 Tudor Ln New Lenox, IL 60451
Estimated Value: $358,846 - $545,000
--
Bed
--
Bath
--
Sq Ft
0.47
Acres
About This Home
This home is located at 1712 Tudor Ln, New Lenox, IL 60451 and is currently estimated at $421,962. 1712 Tudor Ln is a home located in Will County with nearby schools including Spencer Trail, Spencer Pointe, and Spencer Crossing Intermediate School.
Ownership History
Date
Name
Owned For
Owner Type
Purchase Details
Closed on
Nov 15, 2002
Sold by
Horan Susan and Raducha Roger A
Bought by
Fulfs Brandt
Current Estimated Value
Home Financials for this Owner
Home Financials are based on the most recent Mortgage that was taken out on this home.
Original Mortgage
$105,000
Outstanding Balance
$44,626
Interest Rate
6.22%
Estimated Equity
$377,336
Purchase Details
Closed on
Jul 3, 2001
Sold by
Horan Susan
Bought by
Horan Susan and Raducha Roger A
Purchase Details
Closed on
Aug 14, 2000
Sold by
Falge Joseph and Falge Tina
Bought by
Horan Susan
Home Financials for this Owner
Home Financials are based on the most recent Mortgage that was taken out on this home.
Original Mortgage
$174,500
Interest Rate
8.16%
Mortgage Type
Stand Alone First
Purchase Details
Closed on
Nov 18, 1994
Sold by
Branigan Timothy and Branigan Catherine M
Bought by
Falge Joseph and Weiss Tina
Home Financials for this Owner
Home Financials are based on the most recent Mortgage that was taken out on this home.
Original Mortgage
$144,888
Interest Rate
8.91%
Mortgage Type
FHA
Create a Home Valuation Report for This Property
The Home Valuation Report is an in-depth analysis detailing your home's value as well as a comparison with similar homes in the area
Home Values in the Area
Average Home Value in this Area
Purchase History
| Date | Buyer | Sale Price | Title Company |
|---|---|---|---|
| Fulfs Brandt | $185,000 | Chicago Title Insurance Co | |
| Horan Susan | -- | -- | |
| Horan Susan | $174,500 | Chicago Title Insurance Co | |
| Falge Joseph | $148,000 | -- |
Source: Public Records
Mortgage History
| Date | Status | Borrower | Loan Amount |
|---|---|---|---|
| Open | Fulfs Brandt | $105,000 | |
| Previous Owner | Horan Susan | $174,500 | |
| Previous Owner | Falge Joseph | $144,888 |
Source: Public Records
Tax History Compared to Growth
Tax History
| Year | Tax Paid | Tax Assessment Tax Assessment Total Assessment is a certain percentage of the fair market value that is determined by local assessors to be the total taxable value of land and additions on the property. | Land | Improvement |
|---|---|---|---|---|
| 2024 | $8,262 | $113,592 | $33,360 | $80,232 |
| 2023 | $8,262 | $103,548 | $30,410 | $73,138 |
| 2022 | $7,456 | $95,392 | $28,015 | $67,377 |
| 2021 | $7,074 | $89,713 | $26,347 | $63,366 |
| 2020 | $6,868 | $86,512 | $25,407 | $61,105 |
| 2019 | $6,566 | $83,829 | $24,619 | $59,210 |
| 2018 | $6,410 | $80,939 | $23,770 | $57,169 |
| 2017 | $6,081 | $78,612 | $23,087 | $55,525 |
| 2016 | $5,900 | $76,508 | $22,469 | $54,039 |
| 2015 | $5,708 | $74,100 | $21,762 | $52,338 |
| 2014 | $5,708 | $73,185 | $21,493 | $51,692 |
| 2013 | $5,708 | $74,172 | $21,783 | $52,389 |
Source: Public Records
Map
Nearby Homes
- 911 Canongate Ln
- 1990 Edgeview Dr
- LOT 8 W Laraway Rd
- 2185 Bristol Park Rd
- 2067 Edgeview Dr
- 22559 S Country Ln
- 575 Caledonia Dr
- Raleigh Plan at Calistoga
- Siena II Plan at Calistoga
- Galveston Plan at Calistoga
- Brooklyn Plan at Calistoga
- Ontario Plan at Calistoga
- Westbury Plan at Calistoga
- 920 Barnside Rd
- 13255 W Laraway Rd
- 2231 Stone Creek Dr
- 2241 Stone Creek Dr
- 2251 Stone Creek Dr
- 500 E Laraway Rd
- 550 E Laraway Rd