1713 8th St Alameda, CA 94501
West Alameda NeighborhoodEstimated Value: $825,859 - $1,087,000
2
Beds
1
Bath
1,129
Sq Ft
$816/Sq Ft
Est. Value
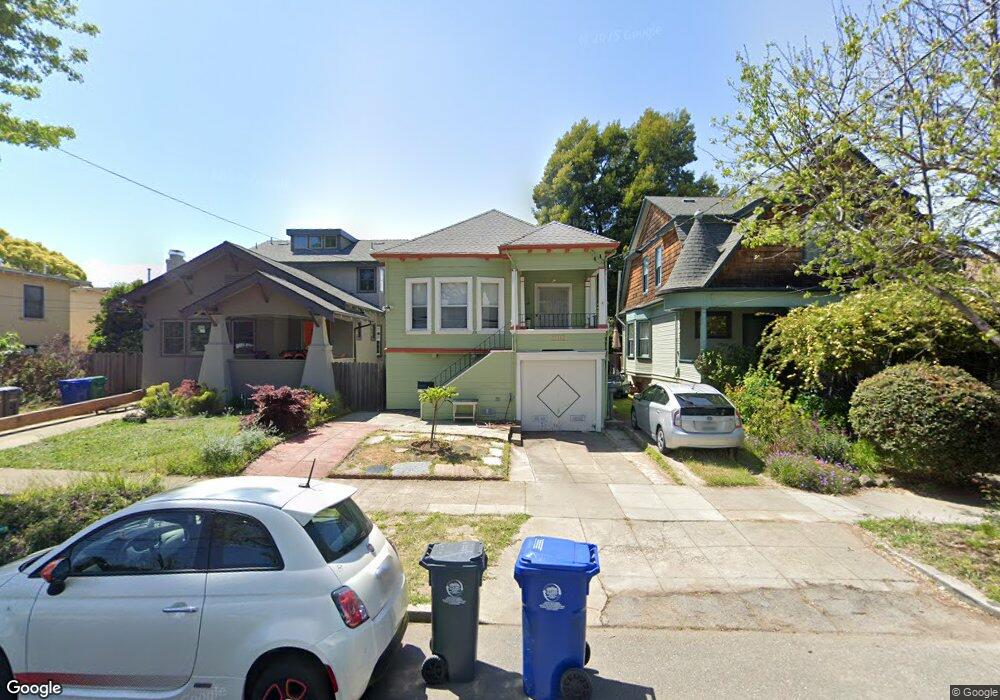
About This Home
This home is located at 1713 8th St, Alameda, CA 94501 and is currently estimated at $921,215, approximately $815 per square foot. 1713 8th St is a home located in Alameda County with nearby schools including Ruby Bridges Elementary School, Encinal Junior/Senior High, and The Academy of Alameda TK-8 School.
Ownership History
Date
Name
Owned For
Owner Type
Purchase Details
Closed on
Jan 22, 2008
Sold by
Lim Fong Christina and Lim Fong Yick
Bought by
Fong Christina
Current Estimated Value
Purchase Details
Closed on
Apr 6, 1998
Sold by
Dang Nghia M
Bought by
Lim Fong Christina and Lim Fong Yick
Home Financials for this Owner
Home Financials are based on the most recent Mortgage that was taken out on this home.
Original Mortgage
$166,400
Interest Rate
7.07%
Purchase Details
Closed on
Oct 24, 1995
Sold by
Cheung Cathy Chui Ming
Bought by
Dang Nghia Mike
Home Financials for this Owner
Home Financials are based on the most recent Mortgage that was taken out on this home.
Original Mortgage
$132,000
Interest Rate
7.58%
Create a Home Valuation Report for This Property
The Home Valuation Report is an in-depth analysis detailing your home's value as well as a comparison with similar homes in the area
Home Values in the Area
Average Home Value in this Area
Purchase History
| Date | Buyer | Sale Price | Title Company |
|---|---|---|---|
| Fong Christina | -- | None Available | |
| Lim Fong Christina | $208,000 | North American Title Co | |
| Dang Nghia Mike | $66,000 | Old Republic Title Company |
Source: Public Records
Mortgage History
| Date | Status | Borrower | Loan Amount |
|---|---|---|---|
| Closed | Lim Fong Christina | $166,400 | |
| Previous Owner | Dang Nghia Mike | $132,000 |
Source: Public Records
Tax History
| Year | Tax Paid | Tax Assessment Tax Assessment Total Assessment is a certain percentage of the fair market value that is determined by local assessors to be the total taxable value of land and additions on the property. | Land | Improvement |
|---|---|---|---|---|
| 2025 | $5,806 | $332,107 | $99,632 | $232,475 |
| 2024 | $5,806 | $325,596 | $97,679 | $227,917 |
| 2023 | $5,607 | $319,213 | $95,764 | $223,449 |
| 2022 | $5,488 | $312,954 | $93,886 | $219,068 |
| 2021 | $5,365 | $306,818 | $92,045 | $214,773 |
| 2020 | $5,302 | $303,673 | $91,102 | $212,571 |
| 2019 | $4,901 | $297,720 | $89,316 | $208,404 |
| 2018 | $4,787 | $291,884 | $87,565 | $204,319 |
| 2017 | $4,592 | $286,161 | $85,848 | $200,313 |
| 2016 | $4,583 | $280,551 | $84,165 | $196,386 |
| 2015 | $4,563 | $276,337 | $82,901 | $193,436 |
| 2014 | $4,381 | $270,925 | $81,277 | $189,648 |
Source: Public Records
Map
Nearby Homes
- 1834 8th St
- 1527 8th St
- 2180 Barnes Wharf Ln
- 2058 Barnes Wharf Ln
- 1512 Mozart St
- 1523 Verdi St
- 9 Regulus Ct
- 1305 Webster St Unit C202
- 1000 Central Ave
- 1333 Webster St Unit A107
- 1705 5th St
- 473 Pacific Ave
- 1327 Webster St Unit B210
- 1321 Webster St Unit D103
- 1321 Webster St Unit D116
- 1321 Webster St Unit D119
- 1321 Webster St Unit D319
- 1217 Lincoln Ave
- 3009 Triumph Dr
- 417 Lincoln Ave
- 1711 8th St
- 1717 8th St
- 1719 8th St
- 781 Pacific Ave
- 775 Pacific Ave
- 785 Pacific Ave
- 777 Pacific Ave
- 1723 8th St
- 773 Pacific Ave
- 772 Buena Vista Ave
- 782 Buena Vista Ave
- 776 Buena Vista Ave
- 771 Pacific Ave
- 770 Buena Vista Ave
- 801 Pacific Ave
- 1710 8th St
- 767 Pacific Ave
- 1712 8th St
- 1716 8th St
- 778 Pacific Ave
Your Personal Tour Guide
Ask me questions while you tour the home.