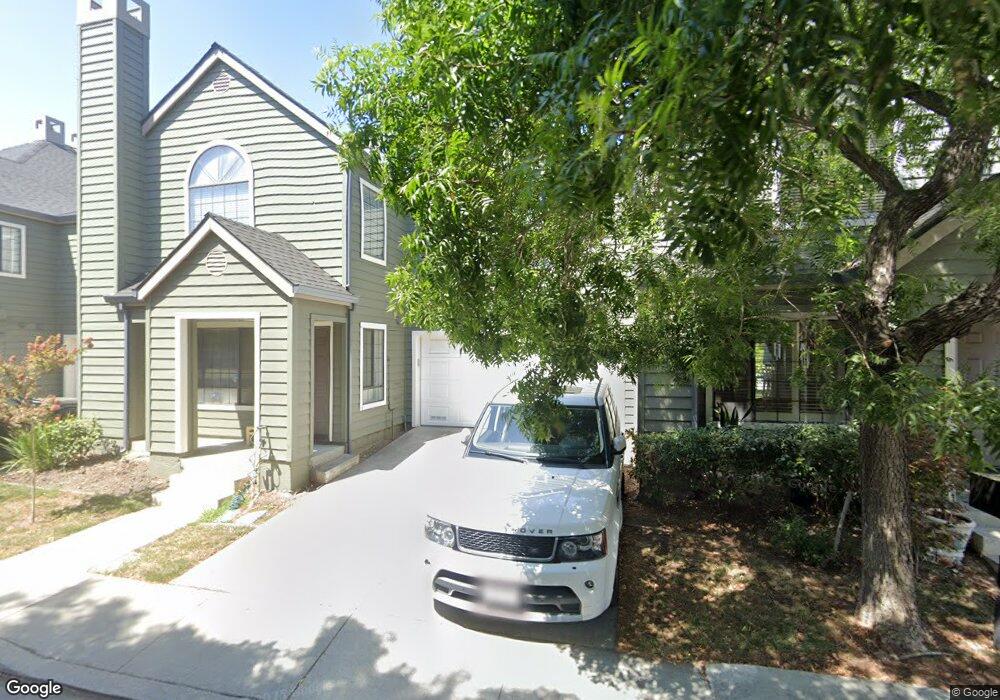
1713 Holin St San Jose, CA 95131
Vinci South NeighborhoodEstimated Value: $1,181,000 - $1,487,000
3
Beds
3
Baths
1,666
Sq Ft
$775/Sq Ft
Est. Value
About This Home
This home is located at 1713 Holin St, San Jose, CA 95131 and is currently estimated at $1,291,464, approximately $775 per square foot. 1713 Holin St is a home located in Santa Clara County with nearby schools including Vinci Park Elementary School, Morrill Middle School, and Independence High School.
Ownership History
Date
Name
Owned For
Owner Type
Purchase Details
Closed on
Jul 8, 2011
Sold by
Reyes Filemon G and Reyes Magdalena A
Bought by
Loi Tony
Current Estimated Value
Home Financials for this Owner
Home Financials are based on the most recent Mortgage that was taken out on this home.
Original Mortgage
$439,200
Outstanding Balance
$291,098
Interest Rate
3.75%
Mortgage Type
Adjustable Rate Mortgage/ARM
Estimated Equity
$1,000,366
Purchase Details
Closed on
Oct 23, 2006
Sold by
Reyes Filemon G and Reyes Magdalena A
Bought by
Reyes Filemon G and Reyes Magdalena A
Create a Home Valuation Report for This Property
The Home Valuation Report is an in-depth analysis detailing your home's value as well as a comparison with similar homes in the area
Home Values in the Area
Average Home Value in this Area
Purchase History
| Date | Buyer | Sale Price | Title Company |
|---|---|---|---|
| Loi Tony | $488,000 | Chicago Title Company | |
| Reyes Filemon G | -- | None Available |
Source: Public Records
Mortgage History
| Date | Status | Borrower | Loan Amount |
|---|---|---|---|
| Open | Loi Tony | $439,200 |
Source: Public Records
Tax History Compared to Growth
Tax History
| Year | Tax Paid | Tax Assessment Tax Assessment Total Assessment is a certain percentage of the fair market value that is determined by local assessors to be the total taxable value of land and additions on the property. | Land | Improvement |
|---|---|---|---|---|
| 2025 | $8,998 | $612,944 | $245,177 | $367,767 |
| 2024 | $8,998 | $600,926 | $240,370 | $360,556 |
| 2023 | $8,827 | $589,144 | $235,657 | $353,487 |
| 2022 | $8,789 | $577,593 | $231,037 | $346,556 |
| 2021 | $8,497 | $566,268 | $226,507 | $339,761 |
| 2020 | $8,227 | $560,463 | $224,185 | $336,278 |
| 2019 | $7,910 | $549,475 | $219,790 | $329,685 |
| 2018 | $7,794 | $538,702 | $215,481 | $323,221 |
| 2017 | $7,835 | $528,140 | $211,256 | $316,884 |
| 2016 | $7,507 | $517,785 | $207,114 | $310,671 |
| 2015 | $7,418 | $510,008 | $204,003 | $306,005 |
| 2014 | $6,759 | $500,018 | $200,007 | $300,011 |
Source: Public Records
Map
Nearby Homes
- 1713 Winston St
- 1146 Rosebriar Way
- 1660 Solari Place
- 1210 Briarcreek Ct
- 1036 Onofrio Ln Unit 6
- 1233 Briarleaf Cir
- 1538 Neleigh Place
- 1368 Neleigh Place
- 1337 Araujo St
- 1767 Clove Ct
- 1049 Branbury Way
- 2044 Voss Park Ln
- 1612 Parkview Green Cir
- 1809 Sageland Dr
- 1441 Rocklin Ct Unit 112
- 1087 Yarrow Terrace
- 1055 Thyme Walkway
- 1137 Mallow Terrace
- 1399 Meadow Ridge Cir
- 1957 Cape Horn Dr