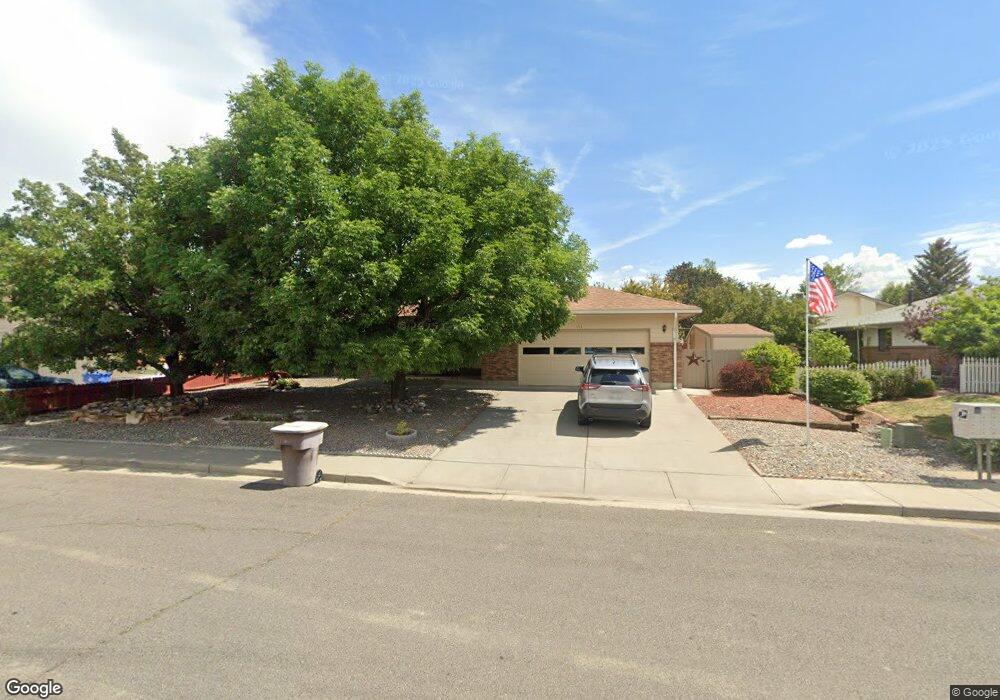
1713 Kent Ave Montrose, CO 81401
Estimated Value: $403,000 - $416,000
3
Beds
2
Baths
1,613
Sq Ft
$254/Sq Ft
Est. Value
About This Home
This home is located at 1713 Kent Ave, Montrose, CO 81401 and is currently estimated at $409,866, approximately $254 per square foot. 1713 Kent Ave is a home located in Montrose County with nearby schools including Pomona Elementary School, Columbine Middle School, and Montrose High School.
Ownership History
Date
Name
Owned For
Owner Type
Purchase Details
Closed on
Oct 18, 2017
Sold by
Cinsneros Barara E and Garicia Barbara E
Bought by
Cisneros Barbara E and Cisneros Jerry A
Current Estimated Value
Purchase Details
Closed on
Oct 18, 2010
Sold by
Enders Douglas A and Enders Esther Kay
Bought by
Garcia Barbara E
Purchase Details
Closed on
Apr 28, 2005
Sold by
Mathias Grayce E
Bought by
Enders Douglas A and Enders Esther Kay
Home Financials for this Owner
Home Financials are based on the most recent Mortgage that was taken out on this home.
Original Mortgage
$175,600
Interest Rate
5.93%
Mortgage Type
Purchase Money Mortgage
Purchase Details
Closed on
Jul 31, 2002
Sold by
Bone John L and Bone Priscilla B
Bought by
Mathias Grayce E
Purchase Details
Closed on
May 23, 2001
Sold by
Paladino Paul H and Paladino Mary J
Bought by
Bone John L and Bone Priscilla B
Purchase Details
Closed on
Mar 18, 1996
Sold by
Phillips Construction Co Inc
Bought by
Paladino Paul H and Paladino Mary J
Create a Home Valuation Report for This Property
The Home Valuation Report is an in-depth analysis detailing your home's value as well as a comparison with similar homes in the area
Home Values in the Area
Average Home Value in this Area
Purchase History
| Date | Buyer | Sale Price | Title Company |
|---|---|---|---|
| Cisneros Barbara E | -- | None Available | |
| Garcia Barbara E | $168,000 | Land Title Guarantee Company | |
| Enders Douglas A | $170,000 | None Available | |
| Mathias Grayce E | $140,000 | -- | |
| Bone John L | $138,500 | -- | |
| Paladino Paul H | $109,000 | -- |
Source: Public Records
Mortgage History
| Date | Status | Borrower | Loan Amount |
|---|---|---|---|
| Previous Owner | Enders Douglas A | $175,600 |
Source: Public Records
Tax History Compared to Growth
Tax History
| Year | Tax Paid | Tax Assessment Tax Assessment Total Assessment is a certain percentage of the fair market value that is determined by local assessors to be the total taxable value of land and additions on the property. | Land | Improvement |
|---|---|---|---|---|
| 2024 | $1,214 | $23,540 | $3,190 | $20,350 |
| 2023 | $1,214 | $28,230 | $3,820 | $24,410 |
| 2022 | $875 | $19,490 | $2,780 | $16,710 |
| 2021 | $1,401 | $20,050 | $2,860 | $17,190 |
| 2020 | $1,250 | $18,390 | $2,470 | $15,920 |
| 2019 | $1,258 | $18,390 | $2,470 | $15,920 |
| 2018 | $1,047 | $14,910 | $1,990 | $12,920 |
| 2017 | $1,038 | $14,910 | $1,990 | $12,920 |
| 2016 | $999 | $14,580 | $2,010 | $12,570 |
| 2015 | $981 | $14,580 | $2,010 | $12,570 |
| 2014 | $840 | $13,340 | $2,010 | $11,330 |
Source: Public Records
Map
Nearby Homes
- 2055 Princeton Way Unit A
- 2135 Winston Way Unit B
- 2036 Scarborough Way Unit J
- 1510 Kent Ave Unit A
- 1510 Kent Ave
- 2038 Winston Way Unit A
- 2125 Hartford Way Unit A
- 2136 Stratford Dr Unit A
- 1323 Manchester Dr
- 2409 Pecan St
- 2210 Devon St
- 2130 Devon St
- 2319 Stone Bridge Dr
- 1239 Leeds Ave
- 1413 Chatam Dr
- Lot 108B Stone Bridge Dr
- 1205 Dover Rd
- 1119 Phillips Ct Unit G
- 1119 Phillips Ct
- 1119 Phillips Ct Unit A
- 1705 Kent Ave
- 2225 James St
- 1714 Manchester Dr
- 1708 Manchester Dr
- 2237 James St
- 1639 Kent Ave
- 1636 Manchester Dr
- 1710 Kent Ave
- 2054 Princeton Way
- 2059 James St
- 0 Kent Ave Unit 603198
- 0 Kent Ave Unit 621236
- 0 Kent Ave Unit 627166
- 0 Kent Ave Unit 628956
- 0 Kent Ave Unit 645921
- 0 Kent Ave Unit 650158
- 0 Kent Ave Unit 651908
- 0 Kent Ave Unit 656731
- 0 Kent Ave Unit 665092
- 0 Kent Ave Unit 669318