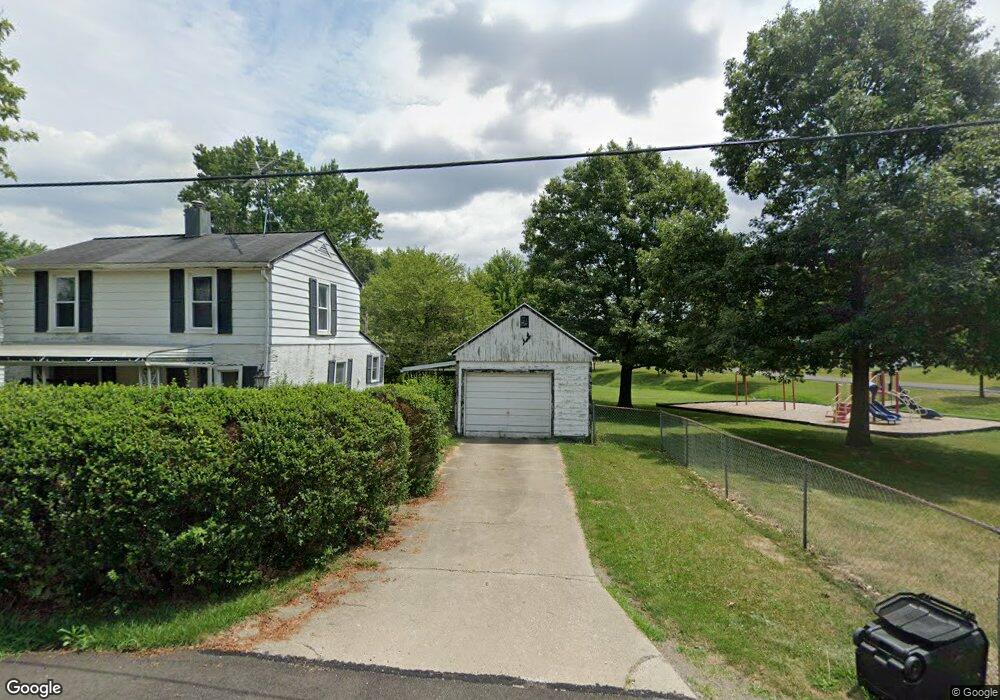
1713 Myers Ave Ashland, OH 44805
Estimated Value: $96,983 - $125,000
2
Beds
1
Bath
1,154
Sq Ft
$99/Sq Ft
Est. Value
About This Home
This home is located at 1713 Myers Ave, Ashland, OH 44805 and is currently estimated at $114,496, approximately $99 per square foot. 1713 Myers Ave is a home located in Ashland County with nearby schools including Ashland High School, Ashland County Community Academy, and St. Edward Elementary School.
Ownership History
Date
Name
Owned For
Owner Type
Purchase Details
Closed on
Oct 27, 2018
Sold by
Lee Akers
Bought by
Albers Michael J
Current Estimated Value
Home Financials for this Owner
Home Financials are based on the most recent Mortgage that was taken out on this home.
Original Mortgage
$43,657
Outstanding Balance
$38,230
Interest Rate
4.6%
Mortgage Type
New Conventional
Estimated Equity
$76,266
Purchase Details
Closed on
Jan 2, 2002
Sold by
Akers Lee
Bought by
Albers Michael J
Purchase Details
Closed on
Sep 8, 2000
Sold by
Roesel Bonnie
Bought by
Akers Lee
Purchase Details
Closed on
Sep 7, 1982
Bought by
Roesel Bonnie
Create a Home Valuation Report for This Property
The Home Valuation Report is an in-depth analysis detailing your home's value as well as a comparison with similar homes in the area
Home Values in the Area
Average Home Value in this Area
Purchase History
| Date | Buyer | Sale Price | Title Company |
|---|---|---|---|
| Albers Michael J | $65,000 | -- | |
| Albers Michael J | $65,000 | -- | |
| Akers Lee | $55,000 | -- | |
| Roesel Bonnie | $16,000 | -- |
Source: Public Records
Mortgage History
| Date | Status | Borrower | Loan Amount |
|---|---|---|---|
| Open | Albers Michael J | $43,657 |
Source: Public Records
Tax History Compared to Growth
Tax History
| Year | Tax Paid | Tax Assessment Tax Assessment Total Assessment is a certain percentage of the fair market value that is determined by local assessors to be the total taxable value of land and additions on the property. | Land | Improvement |
|---|---|---|---|---|
| 2024 | $563 | $16,320 | $2,110 | $14,210 |
| 2023 | $563 | $16,320 | $2,110 | $14,210 |
| 2022 | $617 | $14,200 | $1,840 | $12,360 |
| 2021 | $620 | $14,200 | $1,840 | $12,360 |
| 2020 | $586 | $14,200 | $1,840 | $12,360 |
| 2019 | $525 | $11,640 | $1,240 | $10,400 |
| 2018 | $530 | $11,640 | $1,240 | $10,400 |
| 2017 | $529 | $11,640 | $1,240 | $10,400 |
| 2016 | $529 | $11,080 | $1,180 | $9,900 |
| 2015 | $524 | $11,080 | $1,180 | $9,900 |
| 2013 | $666 | $13,810 | $1,180 | $12,630 |
Source: Public Records
Map
Nearby Homes