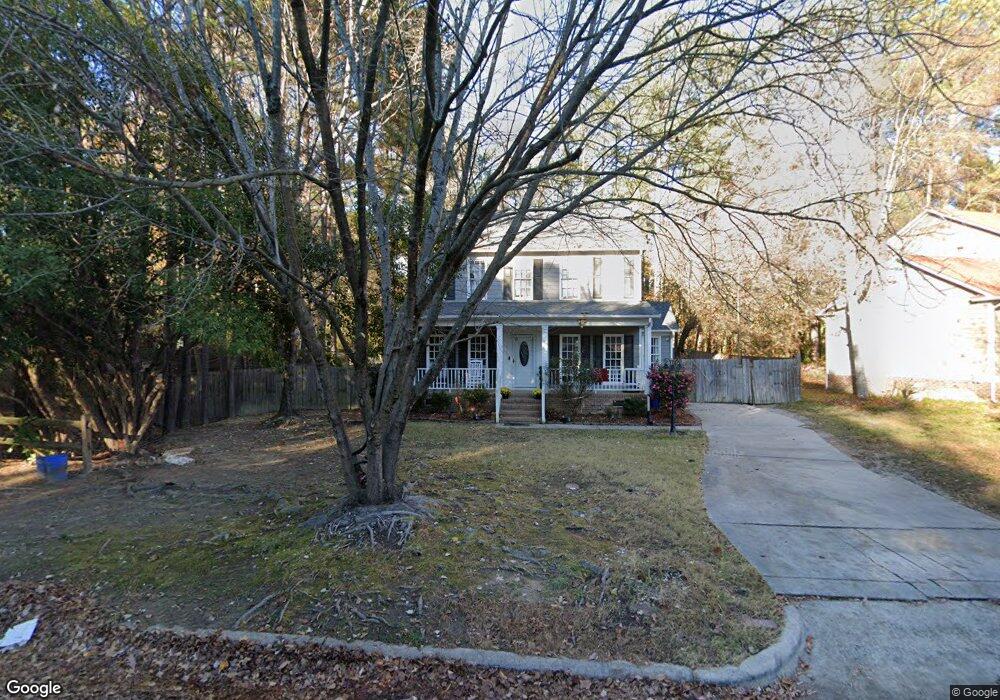
1713 Netherfield Ln Raleigh, NC 27610
Southeast Raleigh NeighborhoodEstimated Value: $327,000 - $406,307
3
Beds
3
Baths
1,550
Sq Ft
$234/Sq Ft
Est. Value
About This Home
This home is located at 1713 Netherfield Ln, Raleigh, NC 27610 and is currently estimated at $362,077, approximately $233 per square foot. 1713 Netherfield Ln is a home located in Wake County with nearby schools including Barwell Road Elementary School, Carnage Magnet Middle School, and South Garner High.
Ownership History
Date
Name
Owned For
Owner Type
Purchase Details
Closed on
Aug 22, 2017
Sold by
Harris Maurie M and Harris Demetria Y
Bought by
Aguilar Vaquera Jose Natividad and Torres Garcia Maria Jessica
Current Estimated Value
Home Financials for this Owner
Home Financials are based on the most recent Mortgage that was taken out on this home.
Original Mortgage
$148,484
Outstanding Balance
$129,398
Interest Rate
5.75%
Mortgage Type
Adjustable Rate Mortgage/ARM
Estimated Equity
$232,679
Purchase Details
Closed on
May 7, 2015
Sold by
Ballo Enterprises Llc
Bought by
Harris Maurice and Harris Demetria
Home Financials for this Owner
Home Financials are based on the most recent Mortgage that was taken out on this home.
Original Mortgage
$142,907
Interest Rate
3.79%
Mortgage Type
VA
Purchase Details
Closed on
Feb 18, 2015
Sold by
Estate Of Carolyn A Wilson and Harris Stephanie
Bought by
Enterprises Ballo
Create a Home Valuation Report for This Property
The Home Valuation Report is an in-depth analysis detailing your home's value as well as a comparison with similar homes in the area
Home Values in the Area
Average Home Value in this Area
Purchase History
| Date | Buyer | Sale Price | Title Company |
|---|---|---|---|
| Aguilar Vaquera Jose Natividad | $165,000 | None Available | |
| Harris Maurice | $140,000 | None Available | |
| Enterprises Ballo | $93,000 | None Available |
Source: Public Records
Mortgage History
| Date | Status | Borrower | Loan Amount |
|---|---|---|---|
| Open | Aguilar Vaquera Jose Natividad | $148,484 | |
| Previous Owner | Harris Maurice | $142,907 |
Source: Public Records
Tax History Compared to Growth
Tax History
| Year | Tax Paid | Tax Assessment Tax Assessment Total Assessment is a certain percentage of the fair market value that is determined by local assessors to be the total taxable value of land and additions on the property. | Land | Improvement |
|---|---|---|---|---|
| 2025 | $3,296 | $375,678 | $90,000 | $285,678 |
| 2024 | $3,283 | $375,678 | $90,000 | $285,678 |
| 2023 | $2,536 | $230,829 | $40,000 | $190,829 |
| 2022 | $2,357 | $230,829 | $40,000 | $190,829 |
| 2021 | $1,822 | $185,190 | $40,000 | $145,190 |
| 2020 | $1,789 | $185,190 | $40,000 | $145,190 |
| 2019 | $1,529 | $130,190 | $30,000 | $100,190 |
| 2018 | $1,442 | $130,190 | $30,000 | $100,190 |
| 2017 | $1,374 | $130,190 | $30,000 | $100,190 |
| 2016 | $1,346 | $130,190 | $30,000 | $100,190 |
| 2015 | $1,403 | $133,545 | $29,000 | $104,545 |
| 2014 | -- | $133,545 | $29,000 | $104,545 |
Source: Public Records
Map
Nearby Homes
- 1810 Eagle Beach Ct
- 1820 Eagle Beach Ct
- 1512 Maybrook Dr
- 5531 Fieldcross Ct
- 5625 Fieldcross Ct
- 5205 Pine Swell Way
- 4910 Blue Rock Ct
- 2225 Walnut Ridge Ct
- 1220 Garden Stone Dr
- 5602 Bringle Ct
- 1220 Canyon Rock Ct Unit 107
- 1211 Canyon Rock Ct Unit 103
- 1211 Canyon Rock Ct Unit 111
- 5121 Jimmy Ridge Place
- 1235 Stone Manor Dr
- 2012 Ranch Mill Cir
- 5520 Oregon Landing Place
- 4408 Poplar Dr
- 5324 Oporto Ct
- 1606 Oxleymare Dr
- 1717 Netherfield Ln
- 1705 Neath Hill Ct
- 1709 Neath Hill Ct
- 1704 Maybrook Dr
- 1712 Maybrook Dr
- 1701 Neath Hill Ct
- 1732 Netherfield Ln
- 1700 Maybrook Dr
- 1728 Netherfield Ln
- 1700 Neath Hill Ct
- 1716 Maybrook Dr
- 1709 Maybrook Dr
- 1724 Netherfield Ln
- 1705 Maybrook Dr
- 1713 Maybrook Dr
- 1720 Netherfield Ln
- 1708 Neath Hill Ct
- 1608 Maybrook Dr
- 1704 Neath Hill Ct
- 1800 Maybrook Dr