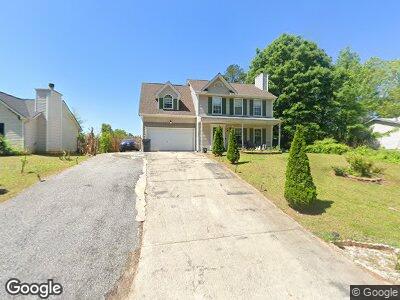
1713 Pheasant Dr Hampton, GA 30228
Estimated Value: $222,000 - $263,000
3
Beds
3
Baths
1,630
Sq Ft
$150/Sq Ft
Est. Value
About This Home
This home is located at 1713 Pheasant Dr, Hampton, GA 30228 and is currently estimated at $244,184, approximately $149 per square foot. 1713 Pheasant Dr is a home located in Clayton County with nearby schools including Kemp Primary School, Kemp Elementary School, and Lovejoy Middle School.
Ownership History
Date
Name
Owned For
Owner Type
Purchase Details
Closed on
Mar 10, 2010
Sold by
Hud-Housing Of Urban Dev
Bought by
Vidales Leobardo
Current Estimated Value
Home Financials for this Owner
Home Financials are based on the most recent Mortgage that was taken out on this home.
Original Mortgage
$42,500
Outstanding Balance
$334
Interest Rate
4.97%
Mortgage Type
New Conventional
Estimated Equity
$238,136
Purchase Details
Closed on
Apr 7, 2009
Sold by
Citimortgage Inc
Bought by
Hud-Housing Of Urban Dev
Purchase Details
Closed on
Jul 28, 1999
Sold by
Anderson Wayne
Bought by
Anderson Wayne and Anderson Christine A
Home Financials for this Owner
Home Financials are based on the most recent Mortgage that was taken out on this home.
Original Mortgage
$109,499
Interest Rate
7.65%
Mortgage Type
FHA
Create a Home Valuation Report for This Property
The Home Valuation Report is an in-depth analysis detailing your home's value as well as a comparison with similar homes in the area
Home Values in the Area
Average Home Value in this Area
Purchase History
| Date | Buyer | Sale Price | Title Company |
|---|---|---|---|
| Vidales Leobardo | -- | -- | |
| Hud-Housing Of Urban Dev | -- | -- | |
| Citimortgage Inc | $167,588 | -- | |
| Anderson Wayne | -- | -- | |
| Anderson Wayne | $109,600 | -- |
Source: Public Records
Mortgage History
| Date | Status | Borrower | Loan Amount |
|---|---|---|---|
| Closed | Vidales Leobardo | $42,500 | |
| Previous Owner | Anderson Wayne | $114,999 | |
| Previous Owner | Anderson Wayne | $109,499 |
Source: Public Records
Tax History Compared to Growth
Tax History
| Year | Tax Paid | Tax Assessment Tax Assessment Total Assessment is a certain percentage of the fair market value that is determined by local assessors to be the total taxable value of land and additions on the property. | Land | Improvement |
|---|---|---|---|---|
| 2024 | $3,284 | $93,280 | $7,200 | $86,080 |
| 2023 | $3,101 | $85,880 | $7,200 | $78,680 |
| 2022 | $2,135 | $63,520 | $7,200 | $56,320 |
| 2021 | $1,703 | $52,240 | $7,200 | $45,040 |
| 2020 | $1,667 | $50,810 | $7,200 | $43,610 |
| 2019 | $1,359 | $42,606 | $6,800 | $35,806 |
| 2018 | $1,207 | $38,864 | $6,800 | $32,064 |
| 2017 | $999 | $33,683 | $6,800 | $26,883 |
| 2016 | $1,046 | $34,849 | $6,800 | $28,049 |
| 2015 | $872 | $0 | $0 | $0 |
| 2014 | $638 | $25,151 | $6,800 | $18,351 |
Source: Public Records
Map
Nearby Homes
- 1685 Kinglet Rd
- 1692 Pheasant Dr
- 1685 Pheasant Dr
- 1741 Portwest Way
- 10996 Shannon Cir
- 10664 Sandpiper Rd
- 10839 Mallard Dr
- 11072 Shannon Cir
- 10074 Tara Glynn Dr
- 1646 Flicker Rd
- 10650 Panhandle Rd
- 11111 Shannon Cir
- 1562 Onalee Dr
- 10988 Mansura Place
- 1579 Leonard St
- 11143 Aliyah Dr
- 11139 Silver Aspen Ct
- 11169 James Madison Dr
- 1713 Pheasant Dr
- 1707 Pheasant Dr
- 1719 Pheasant Dr
- 1697 Spoonbill Rd
- 1695 Spoonbill Rd
- 1714 Pheasant Dr
- 1828 Bridgeport Ln
- 1828 Bridgeport Ln Unit 2
- 1820 Bridgeport Ln Unit 2
- 1712 Pheasant Dr
- 1710 Pheasant Dr
- 1872 Portwest Way
- 1703 Pheasant Dr
- 1825 Bridgeport Ln
- 1696 Spoonbill Rd
- 1817 Bridgeport Ln
- 1851 Portwest Way
- 1691 Spoonbill Rd
- 1694 Spoonbill Rd Unit 15
- 1708 Pheasant Dr