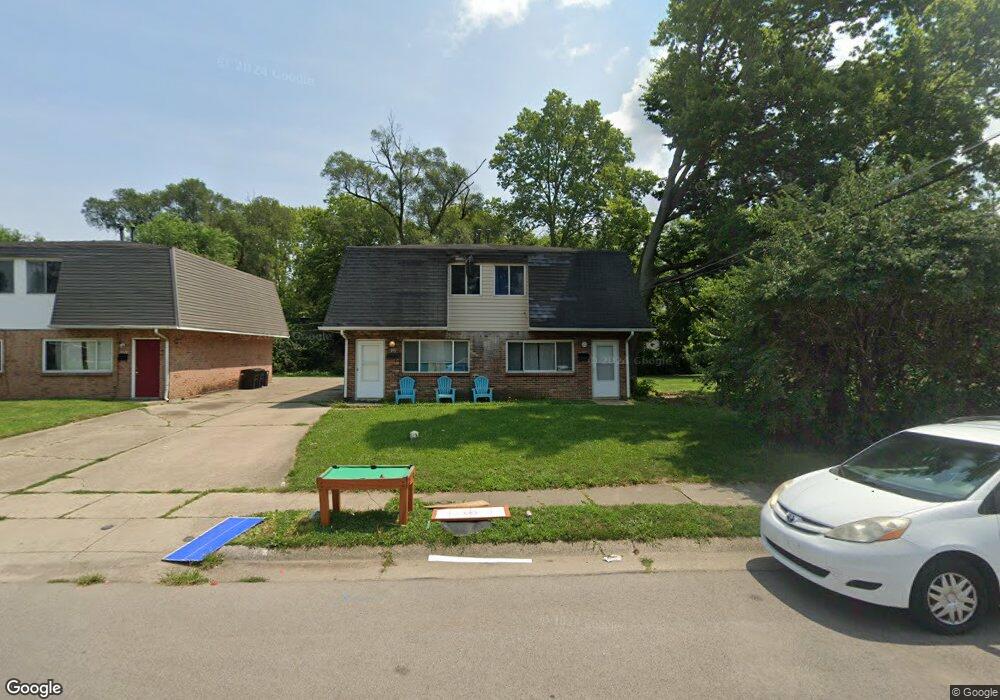
1713 Sheffield St Unit 1715 Middletown, OH 45044
Barbara Park NeighborhoodEstimated Value: $190,931 - $201,000
4
Beds
2
Baths
1,984
Sq Ft
$99/Sq Ft
Est. Value
About This Home
This home is located at 1713 Sheffield St Unit 1715, Middletown, OH 45044 and is currently estimated at $195,983, approximately $98 per square foot. 1713 Sheffield St Unit 1715 is a home located in Butler County with nearby schools including Mayfield Elementary School, Highview 6th Grade Center, and Middletown Middle School.
Ownership History
Date
Name
Owned For
Owner Type
Purchase Details
Closed on
Feb 12, 2024
Sold by
Masadeh Suhail and Masadeh Sarah Hameed
Bought by
Ms1713 Realty Llc
Current Estimated Value
Purchase Details
Closed on
Oct 27, 2023
Sold by
A & S Capital Llc
Bought by
Masadeh Suhail and Masadeh Sarah Hameed
Home Financials for this Owner
Home Financials are based on the most recent Mortgage that was taken out on this home.
Original Mortgage
$148,750
Interest Rate
7.63%
Mortgage Type
Credit Line Revolving
Purchase Details
Closed on
Apr 22, 2022
Sold by
Swearingin Ronald W and Swearingin Teresa A
Bought by
A & S Capital Llc
Purchase Details
Closed on
Sep 24, 2020
Bought by
Swearingin Ronald W and Swearingtin Teresa
Purchase Details
Closed on
Jun 1, 1988
Create a Home Valuation Report for This Property
The Home Valuation Report is an in-depth analysis detailing your home's value as well as a comparison with similar homes in the area
Home Values in the Area
Average Home Value in this Area
Purchase History
| Date | Buyer | Sale Price | Title Company |
|---|---|---|---|
| Ms1713 Realty Llc | -- | None Listed On Document | |
| Ms1713 Realty Llc | -- | None Listed On Document | |
| Masadeh Suhail | $175,000 | None Listed On Document | |
| A & S Capital Llc | $125,000 | None Listed On Document | |
| Swearingin Ronald W | -- | -- | |
| -- | $44,500 | -- |
Source: Public Records
Mortgage History
| Date | Status | Borrower | Loan Amount |
|---|---|---|---|
| Previous Owner | Masadeh Suhail | $148,750 |
Source: Public Records
Tax History Compared to Growth
Tax History
| Year | Tax Paid | Tax Assessment Tax Assessment Total Assessment is a certain percentage of the fair market value that is determined by local assessors to be the total taxable value of land and additions on the property. | Land | Improvement |
|---|---|---|---|---|
| 2024 | $2,252 | $42,490 | $5,050 | $37,440 |
| 2023 | $2,238 | $45,360 | $5,050 | $40,310 |
| 2022 | $2,361 | $25,580 | $5,050 | $20,530 |
| 2021 | $1,467 | $25,580 | $5,050 | $20,530 |
| 2020 | $1,529 | $25,580 | $5,050 | $20,530 |
| 2019 | $1,540 | $24,330 | $5,670 | $18,660 |
| 2018 | $1,576 | $24,330 | $5,670 | $18,660 |
| 2017 | $1,578 | $24,330 | $5,670 | $18,660 |
| 2016 | $1,395 | $20,600 | $5,670 | $14,930 |
| 2015 | $1,375 | $20,600 | $5,670 | $14,930 |
| 2014 | $1,832 | $20,600 | $5,670 | $14,930 |
| 2013 | $1,832 | $29,820 | $5,670 | $24,150 |
Source: Public Records
Map
Nearby Homes
- 1728 Fernwood St
- 1933 Sheffield St
- 1808 Waynebrook Dr
- 3002 Goldman Ave
- 1932 Winton St
- 3220 Barbara Dr
- 1901 Brentwood St
- 1308 Orchard St
- 1030 Jackson Ln
- 1012 Jackson Ln
- 2010 Waynedale Ct
- 3610 Roosevelt Blvd
- 2120 Fernwood St
- 2033 Jackson Ln
- 2030 Waynedale Ct
- 3717 Ellis Way
- 2128 Lamberton St
- 3711 Long Ln
- 800 Orchard St
- 2212 Fernwood St
- 1713 Sheffield St
- 1707 Sheffield St
- 1715 Sheffield St
- 1709 Sheffield St
- 1701 Sheffield St
- 1703 Sheffield St
- 1613 Sheffield St
- 3218 Selden Ave
- 1731 Sheffield St
- 1720 Sheffield St
- 1609 Sheffield St
- 3214 Selden Ave
- 1724 Sheffield St
- 1605 Sheffield St
- 1728 Sheffield St
- 3217 Selden Ave
- 3210 Selden Ave
- 1805 Sheffield St
- 1800 Sheffield St
- 3219 Selden Ave