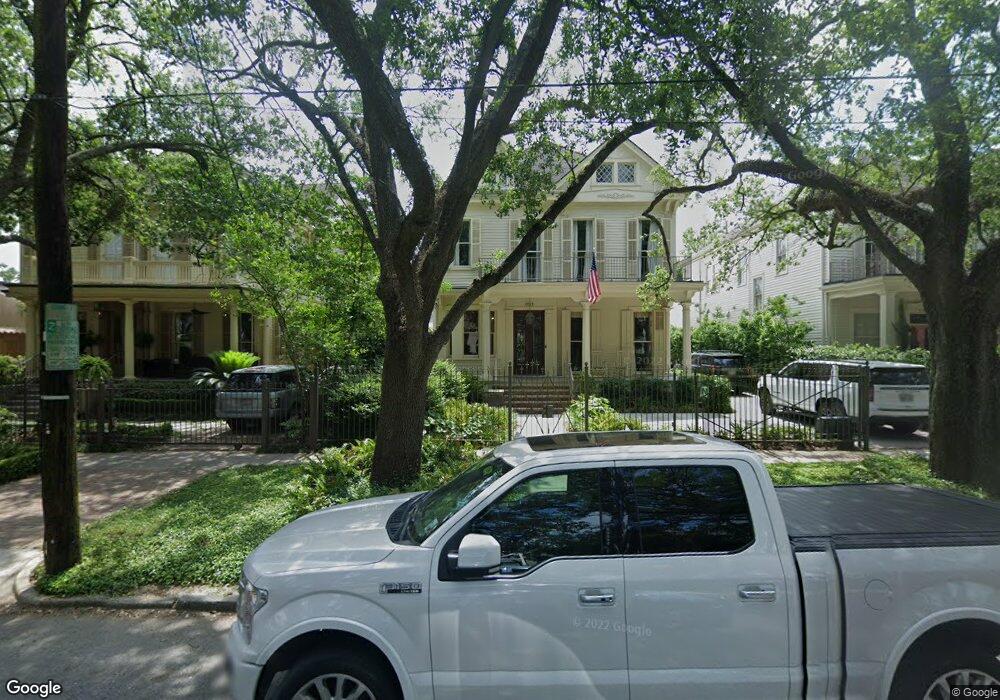
1713 State St New Orleans, LA 70118
Audubon NeighborhoodEstimated Value: $1,542,018 - $1,761,000
5
Beds
4
Baths
4,709
Sq Ft
$353/Sq Ft
Est. Value
About This Home
This home is located at 1713 State St, New Orleans, LA 70118 and is currently estimated at $1,664,006, approximately $353 per square foot. 1713 State St is a home located in Orleans Parish with nearby schools including The Willow School New Orleans, New Orleans Charter Science & Mathematics High School, and Warren Easton Senior High School.
Ownership History
Date
Name
Owned For
Owner Type
Purchase Details
Closed on
Jan 29, 2014
Sold by
Fishman Louis Y
Bought by
Barnett Marshall
Current Estimated Value
Home Financials for this Owner
Home Financials are based on the most recent Mortgage that was taken out on this home.
Original Mortgage
$900,000
Outstanding Balance
$684,045
Interest Rate
4.49%
Mortgage Type
New Conventional
Estimated Equity
$979,961
Create a Home Valuation Report for This Property
The Home Valuation Report is an in-depth analysis detailing your home's value as well as a comparison with similar homes in the area
Home Values in the Area
Average Home Value in this Area
Purchase History
| Date | Buyer | Sale Price | Title Company |
|---|---|---|---|
| Barnett Marshall | -- | -- |
Source: Public Records
Mortgage History
| Date | Status | Borrower | Loan Amount |
|---|---|---|---|
| Open | Barnett Marshall | $900,000 |
Source: Public Records
Tax History Compared to Growth
Tax History
| Year | Tax Paid | Tax Assessment Tax Assessment Total Assessment is a certain percentage of the fair market value that is determined by local assessors to be the total taxable value of land and additions on the property. | Land | Improvement |
|---|---|---|---|---|
| 2025 | $16,447 | $124,260 | $27,360 | $96,900 |
| 2024 | $16,650 | $124,260 | $27,360 | $96,900 |
| 2023 | $16,983 | $126,210 | $17,100 | $109,110 |
| 2022 | $16,983 | $120,750 | $17,100 | $103,650 |
| 2021 | $18,136 | $126,210 | $17,100 | $109,110 |
| 2020 | $12,731 | $87,870 | $17,100 | $70,770 |
| 2019 | $13,190 | $87,870 | $17,100 | $70,770 |
| 2018 | $13,431 | $87,870 | $17,100 | $70,770 |
| 2017 | $11,903 | $87,870 | $17,100 | $70,770 |
| 2016 | $11,644 | $83,700 | $13,680 | $70,020 |
| 2015 | $11,407 | $83,700 | $13,680 | $70,020 |
| 2014 | -- | $83,700 | $13,680 | $70,020 |
| 2013 | -- | $83,700 | $13,680 | $70,020 |
Source: Public Records
Map
Nearby Homes