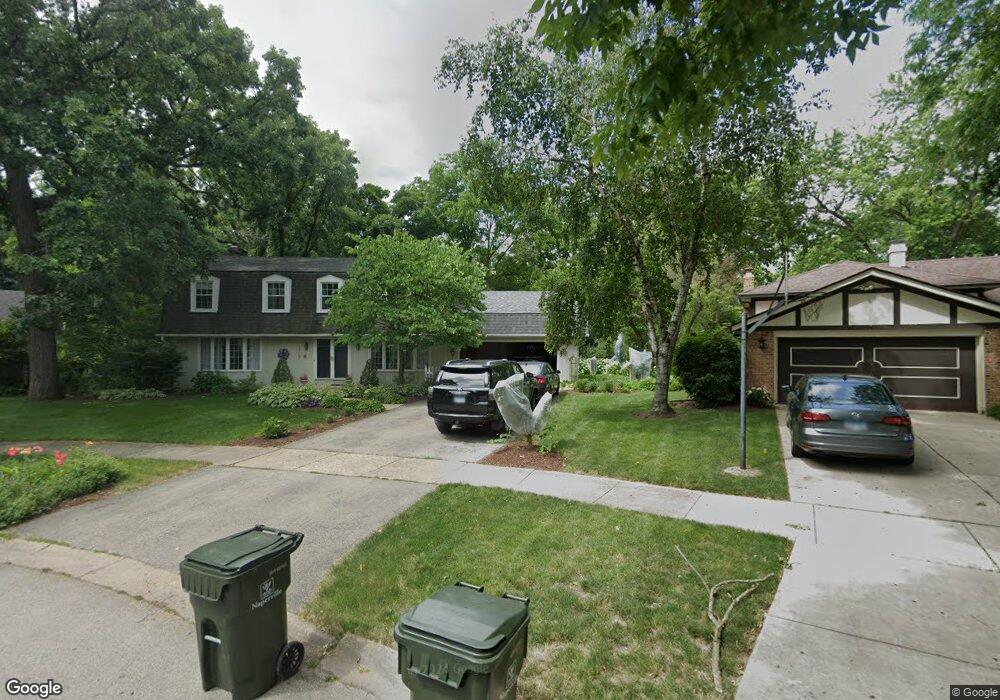
1713 Towpath Ct Naperville, IL 60565
Signal Point NeighborhoodEstimated Value: $618,420 - $669,000
4
Beds
3
Baths
2,561
Sq Ft
$253/Sq Ft
Est. Value
About This Home
This home is located at 1713 Towpath Ct, Naperville, IL 60565 and is currently estimated at $647,355, approximately $252 per square foot. 1713 Towpath Ct is a home located in DuPage County with nearby schools including Scott Elementary School, Madison Jr High School, and Naperville Central High School.
Ownership History
Date
Name
Owned For
Owner Type
Purchase Details
Closed on
Apr 12, 2004
Sold by
Druhot Thomas A and Druhot Heidi S
Bought by
Maclaughlin Scott A and Maclaughlin Suzanne M
Current Estimated Value
Home Financials for this Owner
Home Financials are based on the most recent Mortgage that was taken out on this home.
Original Mortgage
$278,400
Outstanding Balance
$130,737
Interest Rate
5.63%
Mortgage Type
Purchase Money Mortgage
Estimated Equity
$516,618
Purchase Details
Closed on
Jul 24, 2000
Sold by
Geisel Charles E and Geisel Marlene H
Bought by
Druhot Thomas A and Druhot Heidi S
Home Financials for this Owner
Home Financials are based on the most recent Mortgage that was taken out on this home.
Original Mortgage
$201,000
Interest Rate
8.27%
Create a Home Valuation Report for This Property
The Home Valuation Report is an in-depth analysis detailing your home's value as well as a comparison with similar homes in the area
Home Values in the Area
Average Home Value in this Area
Purchase History
| Date | Buyer | Sale Price | Title Company |
|---|---|---|---|
| Maclaughlin Scott A | $348,000 | Pntn | |
| Druhot Thomas A | $267,000 | -- |
Source: Public Records
Mortgage History
| Date | Status | Borrower | Loan Amount |
|---|---|---|---|
| Open | Maclaughlin Scott A | $278,400 | |
| Previous Owner | Druhot Thomas A | $201,000 |
Source: Public Records
Tax History Compared to Growth
Tax History
| Year | Tax Paid | Tax Assessment Tax Assessment Total Assessment is a certain percentage of the fair market value that is determined by local assessors to be the total taxable value of land and additions on the property. | Land | Improvement |
|---|---|---|---|---|
| 2024 | $10,269 | $175,630 | $69,566 | $106,064 |
| 2023 | $9,896 | $160,290 | $63,490 | $96,800 |
| 2022 | $9,455 | $152,090 | $60,240 | $91,850 |
| 2021 | $9,109 | $146,340 | $57,960 | $88,380 |
| 2020 | $8,915 | $143,710 | $56,920 | $86,790 |
| 2019 | $8,655 | $137,500 | $54,460 | $83,040 |
| 2018 | $8,658 | $137,500 | $54,460 | $83,040 |
| 2017 | $8,483 | $132,860 | $52,620 | $80,240 |
| 2016 | $8,314 | $128,060 | $50,720 | $77,340 |
| 2015 | $8,260 | $120,590 | $47,760 | $72,830 |
| 2014 | $8,322 | $117,810 | $45,700 | $72,110 |
| 2013 | $8,197 | $118,090 | $45,810 | $72,280 |
Source: Public Records
Map
Nearby Homes
- 456 Timber Trail Ct
- 621 Bourbon Ct
- 431 Orleans Ave
- 517 Sheffield Rd
- 1717 Drake Ct
- 158 E Bailey Rd Unit F
- 144 E Bailey Rd Unit L
- 138 E Bailey Rd Unit M
- 128 E Bailey Rd Unit G
- 1449 Whitespire Ct Unit 5104
- 1323 Auburn Ave
- 1340 Auburn Ave
- 1721 S Washington St Unit 1721
- 1751 S Washington St Unit 1
- 816 Spindletree Ave
- 302 Carriage Hill Rd
- 336 Brooklea Ct
- 8S452 Bell Dr
- 805 Potomac Ave
- 1704 Kenyon Dr
- 1709 Towpath Ct
- 1717 Towpath Ct
- 1716 Shagbark Ct
- 1712 Shagbark Ct
- 712 Timber Trail Dr
- 1716 Towpath Ct
- 708 Timber Trail Dr
- 1720 Shagbark Ct
- 1745 Indian Trail Dr
- 1749 Indian Trail Dr
- 1708 Shagbark Ct Unit 2
- 1712 Towpath Ct
- 1708 Towpath Ct
- 1737 Indian Trail Dr
- 1752 Indian Trail Dr
- 1721 Shagbark Ct
- 808 Timber Trail Dr
- 1733 Indian Trail Dr
- 1717 Shagbark Ct
- 713 Timber Trail Dr