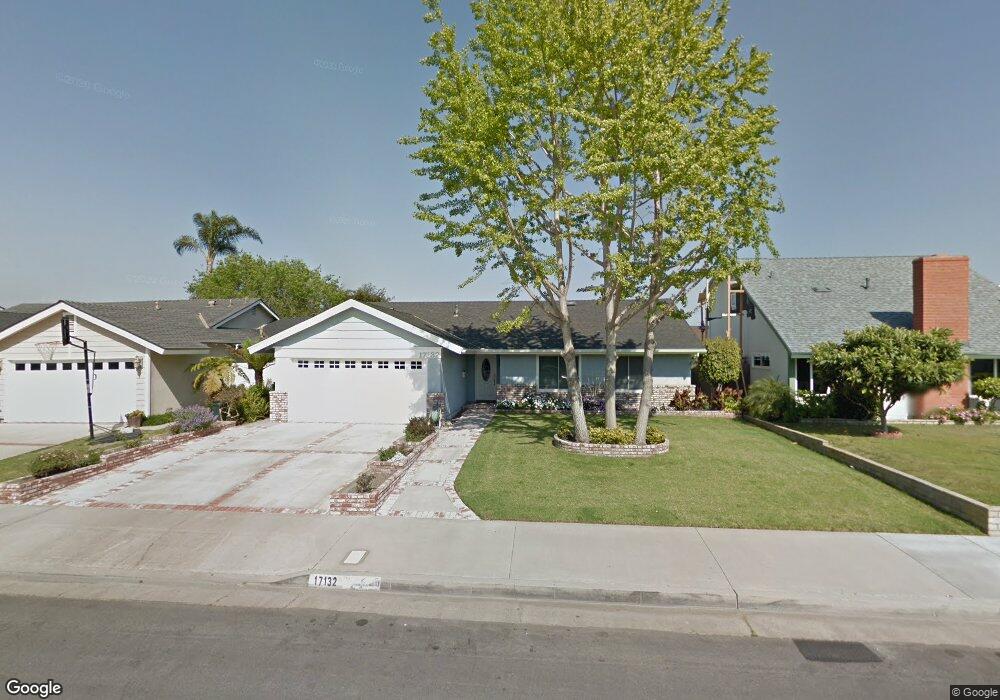
17132 Friml Ln Huntington Beach, CA 92649
Estimated Value: $1,439,347 - $1,691,000
3
Beds
2
Baths
1,810
Sq Ft
$853/Sq Ft
Est. Value
About This Home
This home is located at 17132 Friml Ln, Huntington Beach, CA 92649 and is currently estimated at $1,544,337, approximately $853 per square foot. 17132 Friml Ln is a home located in Orange County with nearby schools including Harbour View Elementary School, Marine View Middle, and Huntington Beach High School.
Ownership History
Date
Name
Owned For
Owner Type
Purchase Details
Closed on
Aug 1, 2018
Sold by
Ping Joseph L and Ping Betty
Bought by
Ping Joseph L and Ping Betty L
Current Estimated Value
Purchase Details
Closed on
May 26, 1997
Sold by
William Kay
Bought by
Ping Joseph L and Ping Betty
Home Financials for this Owner
Home Financials are based on the most recent Mortgage that was taken out on this home.
Original Mortgage
$214,400
Interest Rate
7.93%
Purchase Details
Closed on
Oct 20, 1994
Sold by
Kay William W and Kay Betty G
Bought by
Kay William W and Kay Betty G
Home Financials for this Owner
Home Financials are based on the most recent Mortgage that was taken out on this home.
Original Mortgage
$115,000
Interest Rate
8.7%
Purchase Details
Closed on
Jan 19, 1994
Sold by
Vandever James D
Bought by
Kay William W and Kay Betty G
Create a Home Valuation Report for This Property
The Home Valuation Report is an in-depth analysis detailing your home's value as well as a comparison with similar homes in the area
Home Values in the Area
Average Home Value in this Area
Purchase History
| Date | Buyer | Sale Price | Title Company |
|---|---|---|---|
| Ping Joseph L | -- | None Available | |
| Ping Joseph L | $268,000 | Fidelity National Title Ins | |
| Kay William W | -- | Orange Coast Title Company | |
| Kay William W | -- | -- |
Source: Public Records
Mortgage History
| Date | Status | Borrower | Loan Amount |
|---|---|---|---|
| Previous Owner | Ping Joseph L | $214,400 | |
| Previous Owner | Kay William W | $115,000 |
Source: Public Records
Tax History Compared to Growth
Tax History
| Year | Tax Paid | Tax Assessment Tax Assessment Total Assessment is a certain percentage of the fair market value that is determined by local assessors to be the total taxable value of land and additions on the property. | Land | Improvement |
|---|---|---|---|---|
| 2025 | $4,910 | $427,920 | $313,263 | $114,657 |
| 2024 | $4,910 | $419,530 | $307,121 | $112,409 |
| 2023 | $4,796 | $411,304 | $301,099 | $110,205 |
| 2022 | $4,722 | $403,240 | $295,195 | $108,045 |
| 2021 | $4,635 | $395,334 | $289,407 | $105,927 |
| 2020 | $4,583 | $391,281 | $286,440 | $104,841 |
| 2019 | $4,504 | $383,609 | $280,823 | $102,786 |
| 2018 | $4,403 | $376,088 | $275,317 | $100,771 |
| 2017 | $4,332 | $368,714 | $269,918 | $98,796 |
| 2016 | $4,157 | $361,485 | $264,626 | $96,859 |
| 2015 | $4,092 | $356,056 | $260,651 | $95,405 |
| 2014 | $4,011 | $349,082 | $255,545 | $93,537 |
Source: Public Records
Map
Nearby Homes
- 17042 Twain Ln
- 17352 Eucalyptus Ln
- 17372 Forbes Ln
- 5262 Glenroy Dr
- 5241 Glenroy Dr
- 17532 Montbury Cir
- 17202 Corbina Ln Unit 108
- 6051 Summerdale Dr
- 17191 Corbina Ln Unit 110
- 17071 Pinehurst Ln
- 16832 Roosevelt Ln
- 5812 Raphael Dr
- 5862 Raphael Dr
- 16542 Los Verdes Ln
- 17231 Lido Ln
- 5591 Heil Ave
- 5200 Heil Ave Unit 18
- 5200 Heil Ave Unit 8
- 16652 Busby Ln
- 6301 Warner Ave Unit 40
- 17122 Friml Ln
- 17131 Twain Ln
- 17121 Twain Ln
- 17151 Twain Ln
- 17112 Friml Ln
- 17162 Friml Ln
- 17131 Friml Ln
- 17111 Twain Ln
- 17161 Twain Ln
- 17151 Friml Ln
- 17121 Friml Ln
- 17102 Friml Ln
- 17172 Friml Ln
- 5372 Goldenrod Cir
- 5312 Goldenrod Cir
- 17301 Juniper Ln
- 5232 Goldenrod Cir
- 17361 Juniper Ln
- 5382 Goldenrod Cir
- 5282 Goldenrod Cir