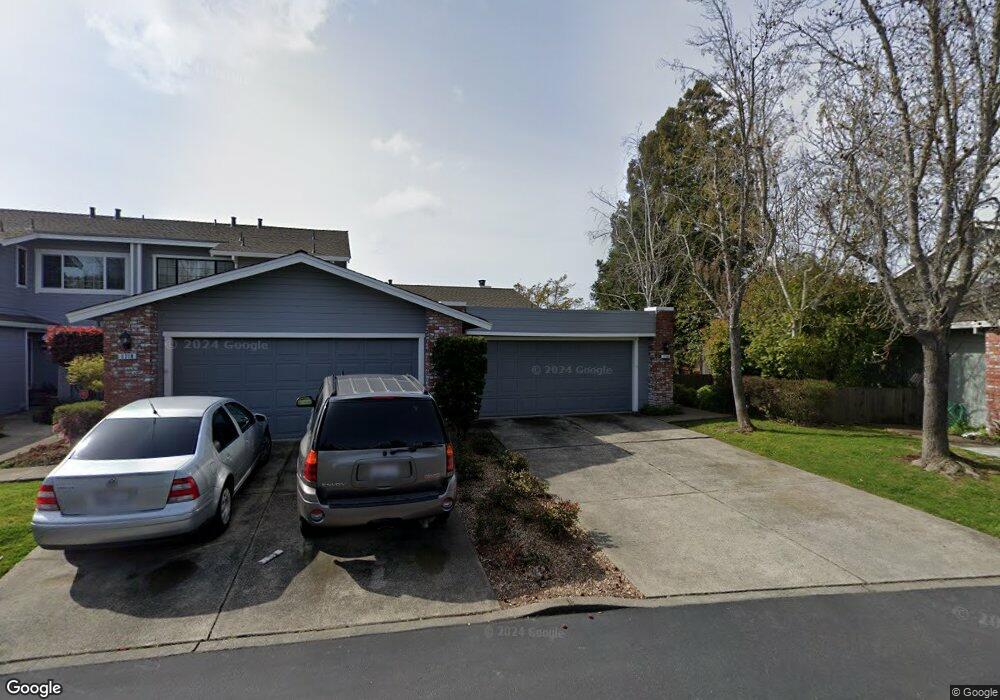
1714 Devonshire Dr Benicia, CA 94510
Estimated Value: $528,000 - $617,000
2
Beds
2
Baths
1,166
Sq Ft
$487/Sq Ft
Est. Value
About This Home
This home is located at 1714 Devonshire Dr, Benicia, CA 94510 and is currently estimated at $568,267, approximately $487 per square foot. 1714 Devonshire Dr is a home located in Solano County with nearby schools including Joe Henderson Elementary School, Benicia Middle School, and Benicia High School.
Ownership History
Date
Name
Owned For
Owner Type
Purchase Details
Closed on
Oct 1, 1999
Sold by
Vonnegut Paul J and Vonnegut Gayle L
Bought by
Vonnegut Petermartin
Current Estimated Value
Home Financials for this Owner
Home Financials are based on the most recent Mortgage that was taken out on this home.
Original Mortgage
$138,400
Outstanding Balance
$41,565
Interest Rate
7.76%
Estimated Equity
$526,702
Purchase Details
Closed on
Dec 18, 1996
Sold by
Summers Grace M
Bought by
Vonnegut Paul J and Vonnegut Gayle L
Purchase Details
Closed on
Apr 11, 1994
Sold by
Summers Grace M
Bought by
Summers Grace M
Purchase Details
Closed on
Oct 27, 1993
Sold by
Summers Grace M and Grace M Summers 1993 Trust
Bought by
Summers Grace M
Home Financials for this Owner
Home Financials are based on the most recent Mortgage that was taken out on this home.
Original Mortgage
$116,000
Interest Rate
6.97%
Purchase Details
Closed on
May 5, 1993
Sold by
Summers Grace M
Bought by
Summers Grace M and Grace M Summers 1993 Trust
Create a Home Valuation Report for This Property
The Home Valuation Report is an in-depth analysis detailing your home's value as well as a comparison with similar homes in the area
Home Values in the Area
Average Home Value in this Area
Purchase History
| Date | Buyer | Sale Price | Title Company |
|---|---|---|---|
| Vonnegut Petermartin | $173,000 | Chicago Title Co | |
| Vonnegut Paul J | $146,000 | Chicago Title Co | |
| Summers Grace M | -- | -- | |
| Summers Grace M | -- | -- | |
| Summers Grace M | -- | -- |
Source: Public Records
Mortgage History
| Date | Status | Borrower | Loan Amount |
|---|---|---|---|
| Open | Vonnegut Petermartin | $138,400 | |
| Previous Owner | Summers Grace M | $116,000 |
Source: Public Records
Tax History
| Year | Tax Paid | Tax Assessment Tax Assessment Total Assessment is a certain percentage of the fair market value that is determined by local assessors to be the total taxable value of land and additions on the property. | Land | Improvement |
|---|---|---|---|---|
| 2025 | $3,124 | $265,885 | $76,844 | $189,041 |
| 2024 | $3,124 | $260,673 | $75,338 | $185,335 |
| 2023 | $3,049 | $255,562 | $73,861 | $181,701 |
| 2022 | $2,992 | $250,552 | $72,413 | $178,139 |
| 2021 | $2,932 | $245,641 | $70,994 | $174,647 |
| 2020 | $2,893 | $243,124 | $70,267 | $172,857 |
| 2019 | $2,843 | $238,358 | $68,890 | $169,468 |
| 2018 | $2,770 | $233,686 | $67,540 | $166,146 |
| 2017 | $2,706 | $229,105 | $66,216 | $162,889 |
| 2016 | $2,723 | $224,614 | $64,918 | $159,696 |
| 2015 | $2,654 | $221,241 | $63,943 | $157,298 |
| 2014 | $2,623 | $216,908 | $62,691 | $154,217 |
Source: Public Records
Map
Nearby Homes
- 1740 Stuart Ct
- 1474 London Cir
- 1229 Monte Vista Ct
- 1196 Grove Cir
- 507 Union Ct
- 446 York Dr
- 1190 Church St
- 460 Turner Dr
- 900 Southampton Rd Unit 110
- 900 Southampton Rd Unit 2
- 900 Southampton Rd Unit 140
- 900 Southampton Rd
- 900 Southampton Rd Unit 24
- 900 Cambridge Dr Unit 122
- 900 Cambridge Dr Unit 95
- 900 Cambridge Dr Unit 114
- 900 Cambridge Dr Unit 104
- 494 Mills Dr
- 249 Baker St
- 926 W K St
- 1712 Devonshire Dr
- 1710 Devonshire Dr
- 1716 Devonshire Dr
- 1708 Devonshire Dr
- 1718 Devonshire Dr
- 1766 Devonshire Dr
- 1776 Devonshire Dr
- 1770 Devonshire Dr
- 1704 Devonshire Dr
- 1772 Devonshire Dr
- 1722 Devonshire Dr
- 1702 Devonshire Dr
- 1784 Stuart Ct
- 1782 Stuart Ct
- 1778 Stuart Ct
- 1780 Stuart Ct
- 1724 Devonshire Dr
- 1700 Devonshire Dr
Your Personal Tour Guide
Ask me questions while you tour the home.