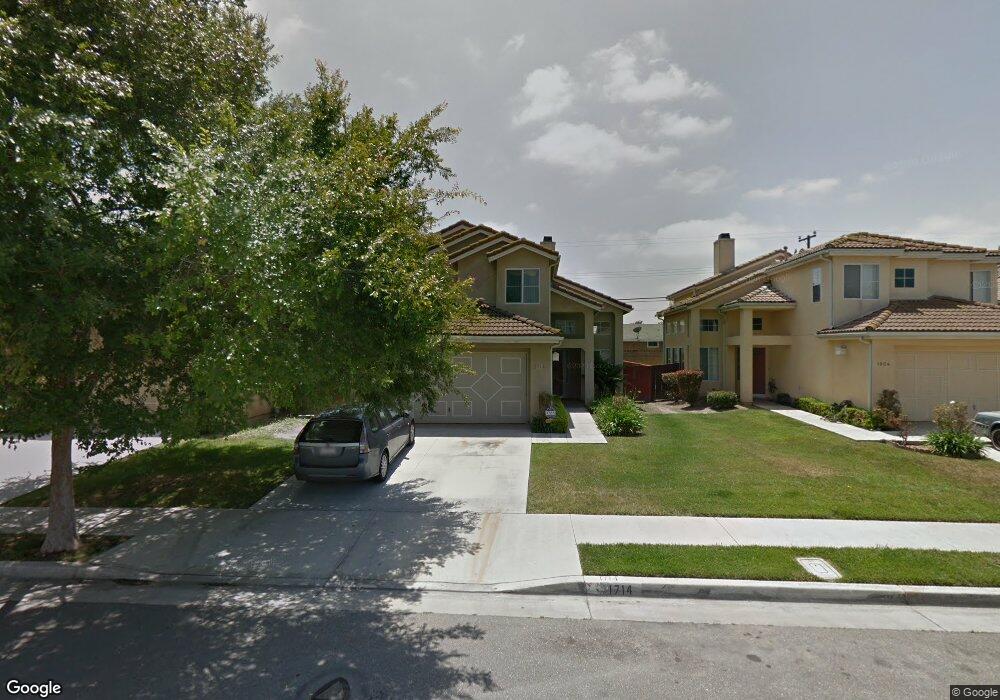
1714 W Stockwell St Compton, CA 90222
Estimated Value: $667,000 - $908,000
3
Beds
3
Baths
4,240
Sq Ft
$187/Sq Ft
Est. Value
About This Home
This home is located at 1714 W Stockwell St, Compton, CA 90222 and is currently estimated at $794,048, approximately $187 per square foot. 1714 W Stockwell St is a home located in Los Angeles County with nearby schools including Ronald E. McNair Elementary School, Enterprise Middle School, and Compton Early College.
Ownership History
Date
Name
Owned For
Owner Type
Purchase Details
Closed on
May 10, 2005
Sold by
Foster Ruett S
Bought by
Foster Ruett S
Current Estimated Value
Home Financials for this Owner
Home Financials are based on the most recent Mortgage that was taken out on this home.
Original Mortgage
$190,000
Outstanding Balance
$98,302
Interest Rate
5.72%
Mortgage Type
New Conventional
Estimated Equity
$695,746
Purchase Details
Closed on
Mar 31, 1999
Sold by
Foster Rhonda Louise
Bought by
Foster Ruett S
Home Financials for this Owner
Home Financials are based on the most recent Mortgage that was taken out on this home.
Original Mortgage
$146,758
Interest Rate
6.79%
Purchase Details
Closed on
Feb 3, 1999
Sold by
Nehemiah West Housing Corp
Bought by
Foster Ruett S
Home Financials for this Owner
Home Financials are based on the most recent Mortgage that was taken out on this home.
Original Mortgage
$146,758
Interest Rate
6.79%
Create a Home Valuation Report for This Property
The Home Valuation Report is an in-depth analysis detailing your home's value as well as a comparison with similar homes in the area
Home Values in the Area
Average Home Value in this Area
Purchase History
| Date | Buyer | Sale Price | Title Company |
|---|---|---|---|
| Foster Ruett S | -- | First American Title Ins Co | |
| Foster Ruett S | -- | Chicago Title Co | |
| Foster Ruett S | $175,000 | First American Title Co |
Source: Public Records
Mortgage History
| Date | Status | Borrower | Loan Amount |
|---|---|---|---|
| Open | Foster Ruett S | $190,000 | |
| Previous Owner | Foster Ruett S | $146,758 |
Source: Public Records
Tax History Compared to Growth
Tax History
| Year | Tax Paid | Tax Assessment Tax Assessment Total Assessment is a certain percentage of the fair market value that is determined by local assessors to be the total taxable value of land and additions on the property. | Land | Improvement |
|---|---|---|---|---|
| 2025 | $5,309 | $274,326 | $76,806 | $197,520 |
| 2024 | $5,309 | $268,948 | $75,300 | $193,648 |
| 2023 | $5,236 | $263,675 | $73,824 | $189,851 |
| 2022 | $4,633 | $258,506 | $72,377 | $186,129 |
| 2021 | $4,650 | $253,438 | $70,958 | $182,480 |
| 2019 | $4,515 | $245,922 | $68,854 | $177,068 |
| 2018 | $4,386 | $241,101 | $67,504 | $173,597 |
| 2016 | $4,130 | $231,741 | $64,884 | $166,857 |
| 2015 | $3,951 | $228,261 | $63,910 | $164,351 |
| 2014 | $3,879 | $223,791 | $62,659 | $161,132 |
Source: Public Records
Map
Nearby Homes
- 1716 W Piru St
- 1613 W Piru St
- 1619 W 136th St
- 1918 W Piru St
- 1505 W 136th St
- 1418 W 134th St
- 2020 N Nestor Ave
- 1808 N Elva Ave
- 2203 N Slater Ave
- 1201 W 138th St
- 1242 W 134th St
- 810 W 133rd St
- 12929 S Central Ave
- 1036 W Stockwell St
- 1210 W 134th St
- 2002 N Salinas Ave
- 1203 W 134th Place
- 2030 N Salinas Ave
- 2703 W 132nd St
- 12812 Clovis Ave
- 1712 W Stockwell St
- 1804 W Stockwell St
- 1706 W Stockwell St
- 1806 W Stockwell St
- 1713 W Piru St
- 1803 W Piru St
- 1711 W Piru St
- 1810 W Stockwell St
- 1704 W Stockwell St
- 1805 W Piru St
- 1705 W Piru St
- 1713 W Stockwell St
- 1803 W Stockwell St
- 1711 W Stockwell St
- 1626 W Stockwell St
- 1812 W Stockwell St
- 1805 W Stockwell St
- 1811 W Piru St
- 1705 W Stockwell St
- 1703 W Piru St