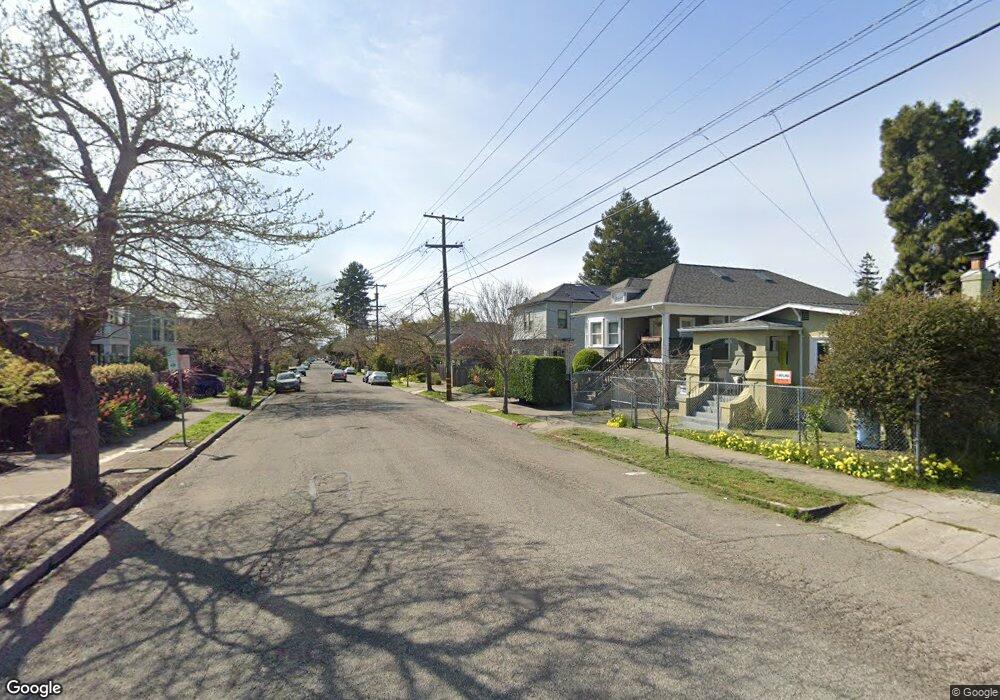
1715 Blake St Berkeley, CA 94703
South Berkeley NeighborhoodEstimated Value: $911,000 - $1,233,000
3
Beds
1
Bath
1,322
Sq Ft
$853/Sq Ft
Est. Value
About This Home
This home is located at 1715 Blake St, Berkeley, CA 94703 and is currently estimated at $1,127,899, approximately $853 per square foot. 1715 Blake St is a home located in Alameda County with nearby schools including Malcolm X Elementary School, Emerson Elementary School, and John Muir Elementary School.
Ownership History
Date
Name
Owned For
Owner Type
Purchase Details
Closed on
May 14, 1998
Sold by
Schrey Thomas J
Bought by
Schrey Deborah S
Current Estimated Value
Home Financials for this Owner
Home Financials are based on the most recent Mortgage that was taken out on this home.
Original Mortgage
$105,000
Interest Rate
7.07%
Create a Home Valuation Report for This Property
The Home Valuation Report is an in-depth analysis detailing your home's value as well as a comparison with similar homes in the area
Home Values in the Area
Average Home Value in this Area
Purchase History
| Date | Buyer | Sale Price | Title Company |
|---|---|---|---|
| Schrey Deborah S | -- | Northwestern Title |
Source: Public Records
Mortgage History
| Date | Status | Borrower | Loan Amount |
|---|---|---|---|
| Previous Owner | Schrey Deborah S | $105,000 |
Source: Public Records
Tax History
| Year | Tax Paid | Tax Assessment Tax Assessment Total Assessment is a certain percentage of the fair market value that is determined by local assessors to be the total taxable value of land and additions on the property. | Land | Improvement |
|---|---|---|---|---|
| 2025 | $5,059 | $166,823 | $136,059 | $37,764 |
| 2024 | $5,059 | $163,415 | $133,391 | $37,024 |
| 2023 | $4,865 | $167,074 | $130,776 | $36,298 |
| 2022 | $4,661 | $156,798 | $128,212 | $35,586 |
| 2021 | $4,635 | $153,587 | $125,698 | $34,889 |
| 2020 | $4,304 | $158,941 | $124,410 | $34,531 |
| 2019 | $4,034 | $155,825 | $121,971 | $33,854 |
| 2018 | $3,927 | $152,770 | $119,580 | $33,190 |
| 2017 | $3,757 | $149,775 | $117,235 | $32,540 |
| 2016 | $3,555 | $146,839 | $114,937 | $31,902 |
| 2015 | $3,488 | $144,634 | $113,211 | $31,423 |
| 2014 | $3,374 | $141,801 | $110,994 | $30,807 |
Source: Public Records
Map
Nearby Homes
- 1645 Dwight Way
- 1612 Parker St
- 1612 Carleton St
- 2701 Grant St
- 1901 Parker St Unit 3
- 1515 Derby St
- 2350 Sacramento St
- 2750 Sacramento St
- 1530 Stuart St
- 1450 Ward St
- 2758 Sacramento St
- 2018 Blake St
- 2774 Sacramento St
- 2782 Sacramento St
- 2790 Sacramento St
- 2218 -2222 Grant St
- 2118 California St
- 1535 Julia St
- 2926 Ellis St
- 1646 Ashby Ave
Your Personal Tour Guide
Ask me questions while you tour the home.