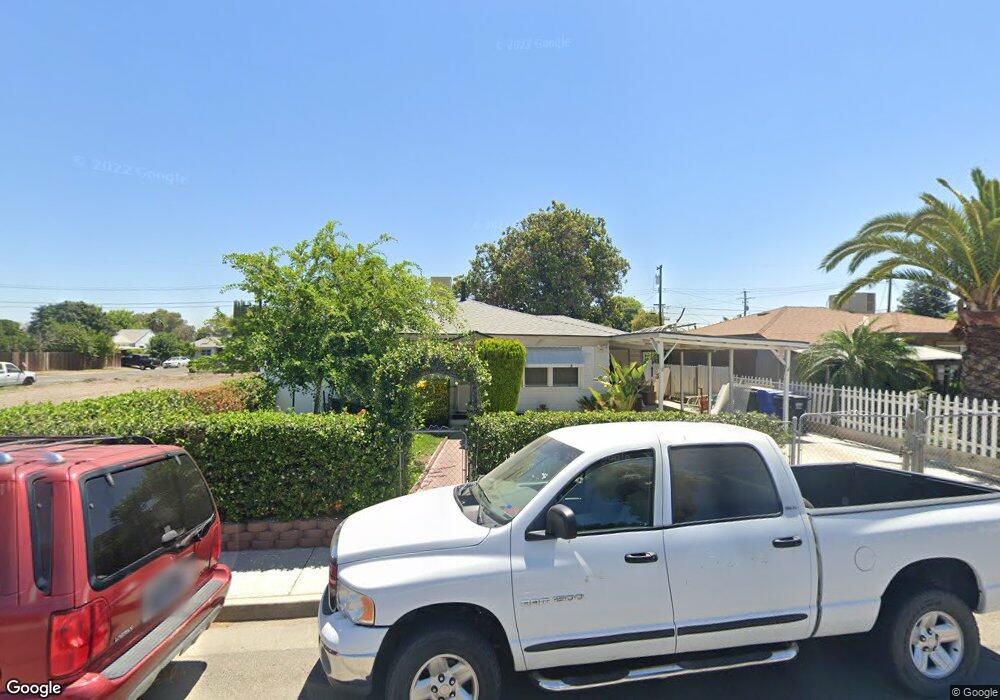
1715 Chase Ave Corcoran, CA 93212
Estimated Value: $219,000 - $258,000
2
Beds
1
Bath
1,242
Sq Ft
$191/Sq Ft
Est. Value
About This Home
This home is located at 1715 Chase Ave, Corcoran, CA 93212 and is currently estimated at $236,838, approximately $190 per square foot. 1715 Chase Ave is a home located in Kings County with nearby schools including Mark Twain Elementary School, Bret Harte Elementary School, and John C. Fremont Elementary School.
Ownership History
Date
Name
Owned For
Owner Type
Purchase Details
Closed on
Sep 24, 2021
Sold by
Cuellar Roman J
Bought by
Cuellar Roman J
Current Estimated Value
Home Financials for this Owner
Home Financials are based on the most recent Mortgage that was taken out on this home.
Original Mortgage
$135,811
Outstanding Balance
$122,767
Interest Rate
2.8%
Mortgage Type
VA
Estimated Equity
$114,071
Purchase Details
Closed on
Jun 7, 2017
Sold by
Cuellar Roman
Bought by
Cuellar Roman J
Home Financials for this Owner
Home Financials are based on the most recent Mortgage that was taken out on this home.
Original Mortgage
$95,000
Interest Rate
4.02%
Mortgage Type
VA
Purchase Details
Closed on
Jun 4, 2015
Sold by
Cuellar Edward V and Cuellar Ascencion J
Bought by
Cuellar Edward V and Cuellar Ascencion J
Purchase Details
Closed on
Oct 29, 1999
Sold by
King Carl and King Aelia
Bought by
Caviness Michael and Caviness Shirley
Create a Home Valuation Report for This Property
The Home Valuation Report is an in-depth analysis detailing your home's value as well as a comparison with similar homes in the area
Purchase History
| Date | Buyer | Sale Price | Title Company |
|---|---|---|---|
| Cuellar Roman J | -- | Placer Title Company | |
| Cuellar Roman J | -- | Chicago Title Company | |
| Cuellar Edward V | -- | None Available | |
| Caviness Michael | -- | -- |
Source: Public Records
Mortgage History
| Date | Status | Borrower | Loan Amount |
|---|---|---|---|
| Open | Cuellar Roman J | $135,811 | |
| Closed | Cuellar Roman J | $95,000 |
Source: Public Records
Tax History
| Year | Tax Paid | Tax Assessment Tax Assessment Total Assessment is a certain percentage of the fair market value that is determined by local assessors to be the total taxable value of land and additions on the property. | Land | Improvement |
|---|---|---|---|---|
| 2025 | -- | $204,000 | $45,900 | $158,100 |
| 2023 | -- | $97,316 | $24,507 | $72,809 |
| 2022 | $0 | $95,409 | $24,027 | $71,382 |
| 2021 | $0 | $93,539 | $23,556 | $69,983 |
| 2020 | $104 | $92,579 | $23,314 | $69,265 |
| 2019 | $1,138 | $90,764 | $22,857 | $67,907 |
| 2018 | $1,124 | $88,984 | $22,409 | $66,575 |
| 2017 | $1,026 | $87,240 | $21,970 | $65,270 |
| 2016 | $849 | $85,529 | $21,539 | $63,990 |
| 2015 | $847 | $84,244 | $21,215 | $63,029 |
| 2014 | $830 | $82,593 | $20,799 | $61,794 |
Source: Public Records
Map
Nearby Homes
- 1701 Chase Ave
- 1036 Bainum Ave
- 1633 Chase Ave
- 1021 Stanley Ave
- 1015 Hall Ave
- 1926 Carnation Ct
- 1801 Hale Ave
- 817 Hall Ave
- 1317 Hall Ave
- 1121 Jepsen Ave
- 1611 Letts Ave
- 1813 Josephine Ave
- 1516 Jepsen Ave
- 1225 Ottawa Ave
- 1530 Ottawa Ave
- 1508 Claire Ave
- 1016 Wigdal Ave
- 2006 Josephine Ave
- 916 Norboe Ave
- 1609 Brewer Ave
- 1723 Chase Ave
- 1731 Chase Ave
- 1712 Chittenden Ave
- 1706 Chase Ave
- 1720 Chittenden Ave
- 1700 Chase Ave
- 1641 Chase Ave
- 1012 Bainum Ave
- 1710 Chase Ave
- 1716 Chase Ave
- 1640 Chittenden Ave
- 1724 Chase Ave
- 1627 Chase Ave
- 1000 Bainum Ave
- 1077 Bainum Ave
- 1055 Bainum Ave
- 1023 Bainum Ave
- 1701 Chittenden Ave
- 1621 Chase Ave
- 1626 Chittenden Ave
Your Personal Tour Guide
Ask me questions while you tour the home.