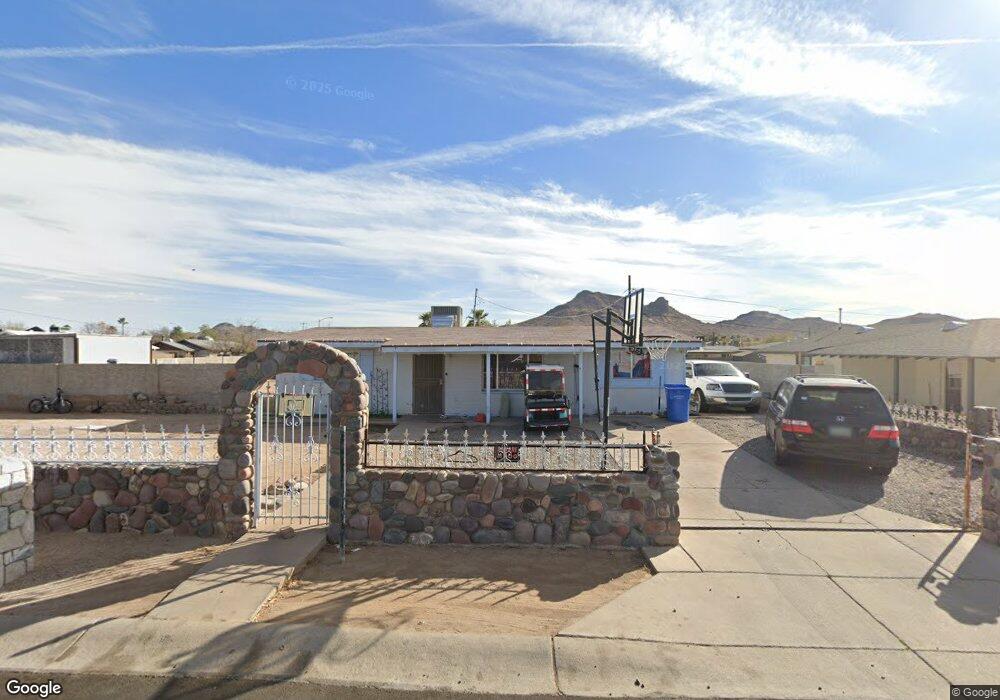
1715 E Phelps Rd Phoenix, AZ 85022
Paradise Valley Village NeighborhoodEstimated Value: $286,680 - $396,000
Studio
2
Baths
1,329
Sq Ft
$245/Sq Ft
Est. Value
About This Home
This home is located at 1715 E Phelps Rd, Phoenix, AZ 85022 and is currently estimated at $325,670, approximately $245 per square foot. 1715 E Phelps Rd is a home located in Maricopa County with nearby schools including Campo Bello Elementary School, Greenway Middle School, and North Canyon High School.
Ownership History
Date
Name
Owned For
Owner Type
Purchase Details
Closed on
Feb 10, 2000
Sold by
Rey Enedina C and Rey Enedina
Bought by
Lee Carlos A
Current Estimated Value
Home Financials for this Owner
Home Financials are based on the most recent Mortgage that was taken out on this home.
Original Mortgage
$77,600
Outstanding Balance
$25,615
Interest Rate
8.14%
Mortgage Type
FHA
Estimated Equity
$300,055
Purchase Details
Closed on
Aug 4, 1999
Sold by
Silva Joan Loera
Bought by
Rey Enedina
Purchase Details
Closed on
Jul 22, 1997
Sold by
Glover Dennis R and Glover Joyce Ann
Bought by
Silva Juan Loera
Home Financials for this Owner
Home Financials are based on the most recent Mortgage that was taken out on this home.
Original Mortgage
$69,581
Interest Rate
7.7%
Mortgage Type
FHA
Purchase Details
Closed on
Mar 19, 1996
Sold by
Phelps Alden W
Bought by
Glover Dennis and Glover Joyce Ann
Create a Home Valuation Report for This Property
The Home Valuation Report is an in-depth analysis detailing your home's value as well as a comparison with similar homes in the area
Home Values in the Area
Average Home Value in this Area
Purchase History
| Date | Buyer | Sale Price | Title Company |
|---|---|---|---|
| Lee Carlos A | $80,000 | Stewart Title & Trust | |
| Rey Enedina | -- | -- | |
| Silva Juan Loera | $75,000 | Security Title Agency | |
| Glover Dennis | $20,000 | United Title Agency |
Source: Public Records
Mortgage History
| Date | Status | Borrower | Loan Amount |
|---|---|---|---|
| Open | Lee Carlos A | $77,600 | |
| Previous Owner | Silva Juan Loera | $69,581 |
Source: Public Records
Tax History
| Year | Tax Paid | Tax Assessment Tax Assessment Total Assessment is a certain percentage of the fair market value that is determined by local assessors to be the total taxable value of land and additions on the property. | Land | Improvement |
|---|---|---|---|---|
| 2025 | $974 | $11,251 | -- | -- |
| 2024 | $928 | $10,715 | -- | -- |
| 2023 | $928 | $27,020 | $5,400 | $21,620 |
| 2022 | $919 | $19,870 | $3,970 | $15,900 |
| 2021 | $934 | $16,600 | $3,320 | $13,280 |
| 2020 | $902 | $15,550 | $3,110 | $12,440 |
| 2019 | $906 | $13,600 | $2,720 | $10,880 |
| 2018 | $873 | $13,430 | $2,680 | $10,750 |
| 2017 | $834 | $10,730 | $2,140 | $8,590 |
| 2016 | $821 | $9,670 | $1,930 | $7,740 |
| 2015 | $364 | $6,000 | $1,200 | $4,800 |
Source: Public Records
Map
Nearby Homes
- 1639 E Aire Libre Ave
- 1705 E Grandview Rd
- 16632 N 18th Place
- 16833 N 17th Place
- 16825 N 18th Place
- 1920 E Bell Rd Unit 1053
- 1920 E Bell Rd Unit 1112
- 1920 E Bell Rd Unit 1132
- 1920 E Bell Rd Unit 1187
- 1920 E Bell Rd Unit 1079
- 1920 E Bell Rd Unit 1061
- 1910 E Sandra Terrace
- 17225 N 16th St Unit 10
- 1851 E Campo Bello Dr
- 1851 E Campo Bello Dr Unit 19
- 2106 E Aire Libre Ave
- 15850 N 15th Way
- 17412 N 16th Place
- 17411 N 15th Place
- 1614 E Kathleen Rd
- 1707 E Phelps Rd
- 1716 E Kelton Ln
- 16637 N 17th Place
- 1708 E Kelton Ln
- 1716 E Phelps Rd
- 16643 N 17th Place
- 1701 E Phelps Rd
- 16631 N 17th Place
- 1708 E Phelps Rd
- 1702 E Kelton Ln
- 16801 N 17th Place
- 1702 E Phelps Rd
- 1649 E Phelps Rd
- 16812 N 17th Place
- 16634 N 18th St
- 16807 N 17th Place
- 1648 E Kelton Ln
- 16640 N 18th St
- 1715 E Kelton Ln
- 16617 N 17th Place