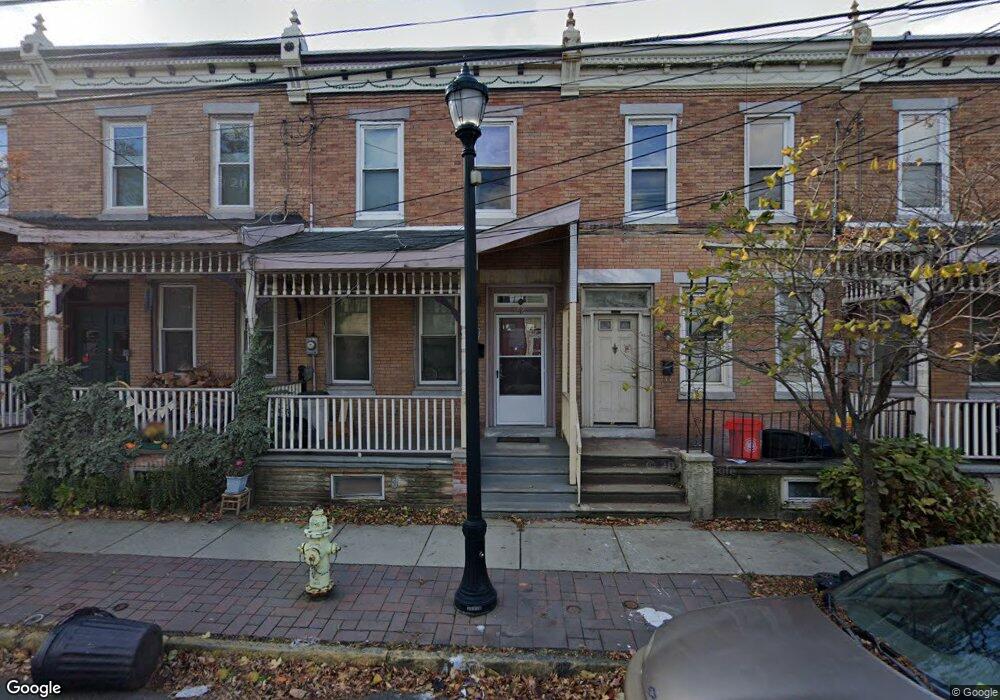
1715 Ferry Ave Camden, NJ 08104
Waterfront South NeighborhoodEstimated Value: $61,000 - $161,000
--
Bed
--
Bath
1,476
Sq Ft
$78/Sq Ft
Est. Value
About This Home
This home is located at 1715 Ferry Ave, Camden, NJ 08104 and is currently estimated at $115,328, approximately $78 per square foot. 1715 Ferry Ave is a home located in Camden County with nearby schools including KIPP Sumner Elementary School, Camden High School, and Hope Community Charter School.
Ownership History
Date
Name
Owned For
Owner Type
Purchase Details
Closed on
Oct 27, 2022
Sold by
Sullivan Brandon
Bought by
Ironwood Finance Inc
Current Estimated Value
Purchase Details
Closed on
Oct 1, 2013
Sold by
The Heart Of Camden Inc
Bought by
Sullivan Brandon and Sullivan Shakira
Home Financials for this Owner
Home Financials are based on the most recent Mortgage that was taken out on this home.
Original Mortgage
$4,000
Interest Rate
4.47%
Mortgage Type
Purchase Money Mortgage
Create a Home Valuation Report for This Property
The Home Valuation Report is an in-depth analysis detailing your home's value as well as a comparison with similar homes in the area
Home Values in the Area
Average Home Value in this Area
Purchase History
| Date | Buyer | Sale Price | Title Company |
|---|---|---|---|
| Ironwood Finance Inc | $50,000 | -- | |
| Ironwood Finance Inc | $50,000 | None Listed On Document | |
| Sullivan Brandon | $4,000 | None Available |
Source: Public Records
Mortgage History
| Date | Status | Borrower | Loan Amount |
|---|---|---|---|
| Previous Owner | Sullivan Brandon | $4,000 |
Source: Public Records
Tax History Compared to Growth
Tax History
| Year | Tax Paid | Tax Assessment Tax Assessment Total Assessment is a certain percentage of the fair market value that is determined by local assessors to be the total taxable value of land and additions on the property. | Land | Improvement |
|---|---|---|---|---|
| 2025 | $1,364 | $38,500 | $5,600 | $32,900 |
| 2024 | $1,319 | $38,500 | $5,600 | $32,900 |
| 2023 | $1,319 | $38,500 | $5,600 | $32,900 |
| 2022 | $1,294 | $38,500 | $5,600 | $32,900 |
| 2021 | $1,213 | $38,500 | $5,600 | $32,900 |
| 2020 | $1,224 | $38,500 | $5,600 | $32,900 |
| 2019 | $1,172 | $38,500 | $5,600 | $32,900 |
| 2018 | $1,166 | $38,500 | $5,600 | $32,900 |
| 2017 | $1,138 | $38,500 | $5,600 | $32,900 |
| 2016 | $1,101 | $38,500 | $5,600 | $32,900 |
| 2015 | $1,060 | $38,500 | $5,600 | $32,900 |
| 2014 | $1,035 | $38,500 | $5,600 | $32,900 |
Source: Public Records
Map
Nearby Homes