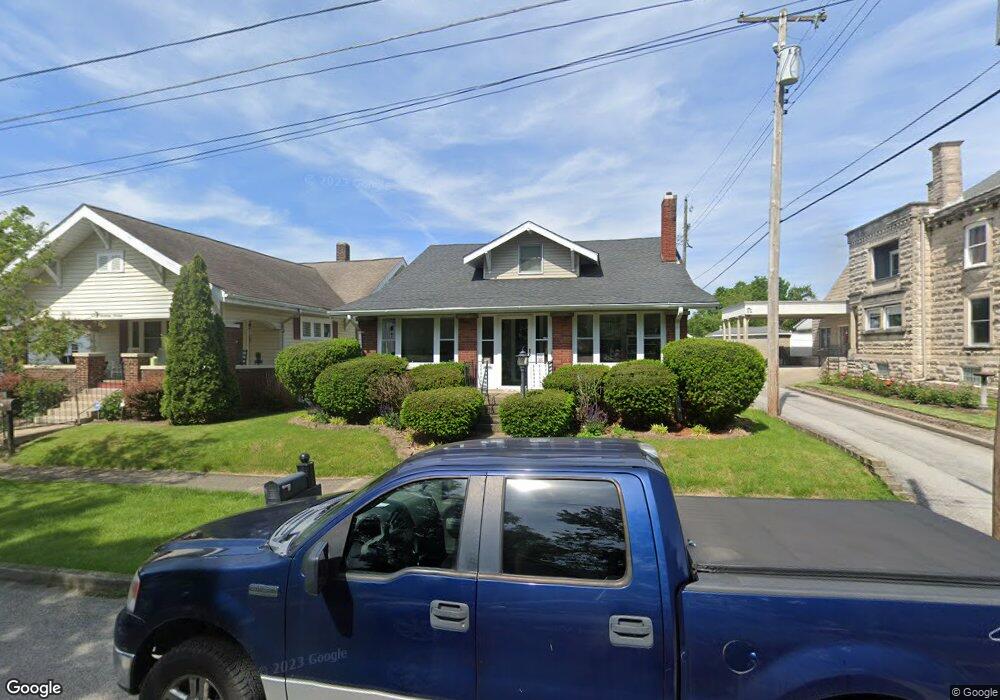
1715 O St Bedford, IN 47421
Estimated Value: $207,866 - $237,000
2
Beds
2
Baths
2,160
Sq Ft
$100/Sq Ft
Est. Value
About This Home
This home is located at 1715 O St, Bedford, IN 47421 and is currently estimated at $216,967, approximately $100 per square foot. 1715 O St is a home located in Lawrence County with nearby schools including Bedford North Lawrence High School, St. Vincent de Paul School, and Stone City Christian Academy.
Ownership History
Date
Name
Owned For
Owner Type
Purchase Details
Closed on
Apr 10, 2012
Sold by
Jeffries Amy L
Bought by
Turner Steven K and Turner Jessica D
Current Estimated Value
Home Financials for this Owner
Home Financials are based on the most recent Mortgage that was taken out on this home.
Original Mortgage
$101,376
Outstanding Balance
$70,022
Interest Rate
3.91%
Mortgage Type
VA
Estimated Equity
$146,946
Purchase Details
Closed on
Sep 28, 2007
Sold by
Crane Jeremy R
Bought by
Garrison Amy L
Create a Home Valuation Report for This Property
The Home Valuation Report is an in-depth analysis detailing your home's value as well as a comparison with similar homes in the area
Home Values in the Area
Average Home Value in this Area
Purchase History
| Date | Buyer | Sale Price | Title Company |
|---|---|---|---|
| Turner Steven K | -- | -- | |
| Garrison Amy L | $98,000 | -- |
Source: Public Records
Mortgage History
| Date | Status | Borrower | Loan Amount |
|---|---|---|---|
| Open | Turner Steven K | $101,376 |
Source: Public Records
Tax History Compared to Growth
Tax History
| Year | Tax Paid | Tax Assessment Tax Assessment Total Assessment is a certain percentage of the fair market value that is determined by local assessors to be the total taxable value of land and additions on the property. | Land | Improvement |
|---|---|---|---|---|
| 2024 | $1,362 | $162,800 | $6,900 | $155,900 |
| 2023 | $1,503 | $150,300 | $6,700 | $143,600 |
| 2022 | $1,385 | $138,500 | $6,500 | $132,000 |
| 2021 | $1,234 | $123,400 | $6,300 | $117,100 |
| 2020 | $1,227 | $122,700 | $6,100 | $116,600 |
| 2019 | $1,183 | $118,300 | $5,900 | $112,400 |
| 2018 | $1,151 | $115,100 | $5,800 | $109,300 |
| 2017 | $1,104 | $110,400 | $5,700 | $104,700 |
| 2016 | $1,093 | $109,300 | $5,500 | $103,800 |
| 2014 | $1,066 | $106,600 | $5,400 | $101,200 |
Source: Public Records
Map
Nearby Homes