1715 Pitchwood Way Hephzibah, GA 30815
McBean NeighborhoodEstimated Value: $208,000 - $238,000
3
Beds
2
Baths
1,590
Sq Ft
$138/Sq Ft
Est. Value
About This Home
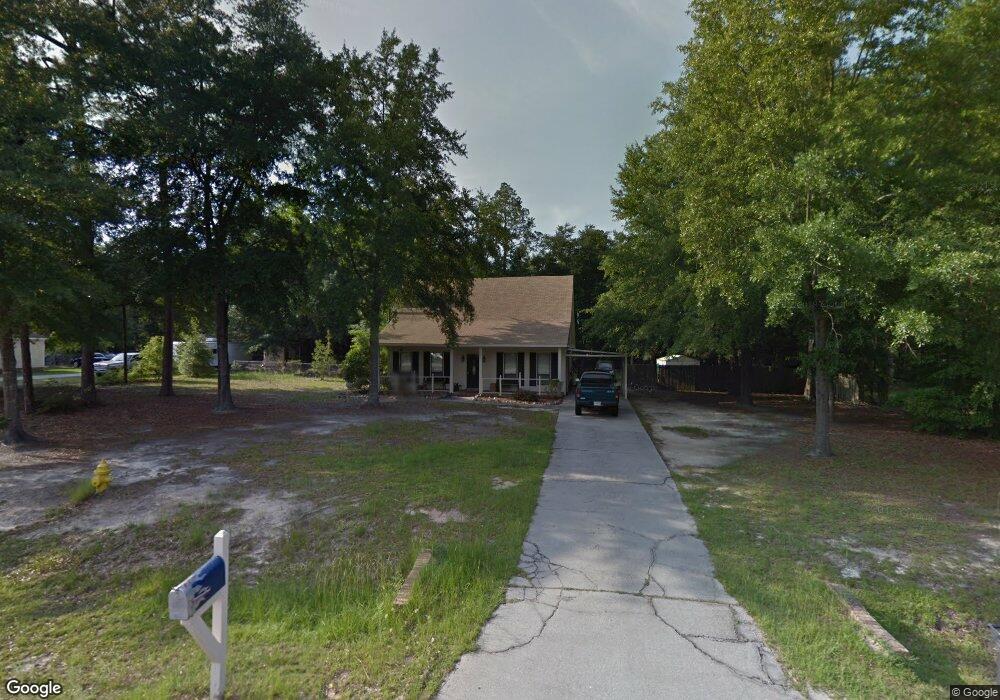
This home is located at 1715 Pitchwood Way, Hephzibah, GA 30815 and is currently estimated at $219,990, approximately $138 per square foot. 1715 Pitchwood Way is a home located in Richmond County with nearby schools including McBean Elementary School, Pine Hill Middle School, and Johnson Magnet.
Ownership History
Date
Name
Owned For
Owner Type
Purchase Details
Closed on
Aug 3, 2007
Sold by
Daniels Debbie I
Bought by
Ingraham Charles W and Daniels Debbie I
Current Estimated Value
Home Financials for this Owner
Home Financials are based on the most recent Mortgage that was taken out on this home.
Original Mortgage
$26,400
Interest Rate
6.05%
Mortgage Type
Credit Line Revolving
Purchase Details
Closed on
Sep 13, 1993
Sold by
Veterans Affairs Se
Bought by
Jones Curtis P
Purchase Details
Closed on
Mar 25, 1993
Sold by
Nationsbanc Mortgage Corp C&S Real Esta
Bought by
Veterans Affairs Secretary Of
Purchase Details
Closed on
Mar 2, 1993
Sold by
Nationsbanc and Nationsbanc Mortgag
Bought by
Veterans Affairs Se
Purchase Details
Closed on
Aug 24, 1992
Sold by
Stanford Anna Maria
Bought by
Borgen Willie L
Purchase Details
Closed on
Jun 17, 1991
Sold by
Stearns Benny James Stearns Gale T
Bought by
Borgen Edward J Borgen Willie L
Purchase Details
Closed on
Jun 6, 1991
Sold by
Stearns Benny James
Bought by
Borgen Edward J
Create a Home Valuation Report for This Property
The Home Valuation Report is an in-depth analysis detailing your home's value as well as a comparison with similar homes in the area
Home Values in the Area
Average Home Value in this Area
Purchase History
| Date | Buyer | Sale Price | Title Company |
|---|---|---|---|
| Ingraham Charles W | -- | None Available | |
| Jones Curtis P | -- | -- | |
| Veterans Affairs Secretary Of | -- | -- | |
| Veterans Affairs Se | $52,300 | -- | |
| Borgen Willie L | -- | -- | |
| Borgen Edward J Borgen Willie L | -- | -- | |
| Borgen Edward J | $60,000 | -- |
Source: Public Records
Mortgage History
| Date | Status | Borrower | Loan Amount |
|---|---|---|---|
| Closed | Ingraham Charles W | $26,400 |
Source: Public Records
Tax History Compared to Growth
Tax History
| Year | Tax Paid | Tax Assessment Tax Assessment Total Assessment is a certain percentage of the fair market value that is determined by local assessors to be the total taxable value of land and additions on the property. | Land | Improvement |
|---|---|---|---|---|
| 2025 | $2,184 | $68,800 | $8,800 | $60,000 |
| 2024 | $2,184 | $60,132 | $8,800 | $51,332 |
| 2023 | $1,382 | $61,844 | $8,800 | $53,044 |
| 2022 | $1,417 | $41,478 | $8,800 | $32,678 |
| 2021 | $1,272 | $33,526 | $8,800 | $24,726 |
| 2020 | $1,256 | $33,526 | $8,800 | $24,726 |
| 2019 | $1,318 | $33,526 | $8,800 | $24,726 |
| 2018 | $1,326 | $33,526 | $8,800 | $24,726 |
| 2017 | $1,326 | $33,526 | $8,800 | $24,726 |
| 2016 | $1,327 | $33,526 | $8,800 | $24,726 |
| 2015 | $1,334 | $33,526 | $8,800 | $24,726 |
| 2014 | $1,336 | $33,526 | $8,800 | $24,726 |
Source: Public Records
Map
Nearby Homes
- 1686 Pine Ridge Dr N
- 1679 Pine Ridge Dr N
- 1663 Pine Ridge Dr N
- 1715 Pine Ridge Dr N
- 1724 Pine Ridge Dr N
- 1660 Pine Ridge Dr N
- 1671 Pine Ridge Dr N
- 1683 Pine Ridge Dr N
- 4331 Big Dipper Cir
- 4065 Goshen Lake Dr S
- 4149 Markwalter Rd
- 4051 Goshen Lake Dr S
- 4047 Goshen Lake Dr S
- 4077 Burning Tree Ln
- 4038 Goshen Lake Dr S
- 4036 Goshen Lake Dr S
- 2114 Southlake Pkwy
- 2121 Southlake Pkwy
- 4415 Seago Rd
- 4011 Brown Hurst Rd
- 1717 Pitchwood Way
- 1713 Pitchwood Way
- 1714 Pitchwood Way
- 1716 Pitchwood Way
- 1719 Pitchwood Way
- 1718 Pitchwood Way
- 1711 Pitchwood Way
- 1612N Pine Ridge Dr N
- 1712 Pitchwood Way
- 1614N Pine Ridge Dr N
- 1720 Pitchwood Way
- 1721 Pitchwood Way
- 1709 Pitchwood Way
- 1610 Pine Ridge Dr N
- 1610 Pine Ridge Dr N
- 1722 Pitchwood Way
- 1710 Pitchwood Way
- 1656 Pine Ridge Dr N
- 1641 Pine Ridge Dr N
- 1655 Pine Ridge Dr N