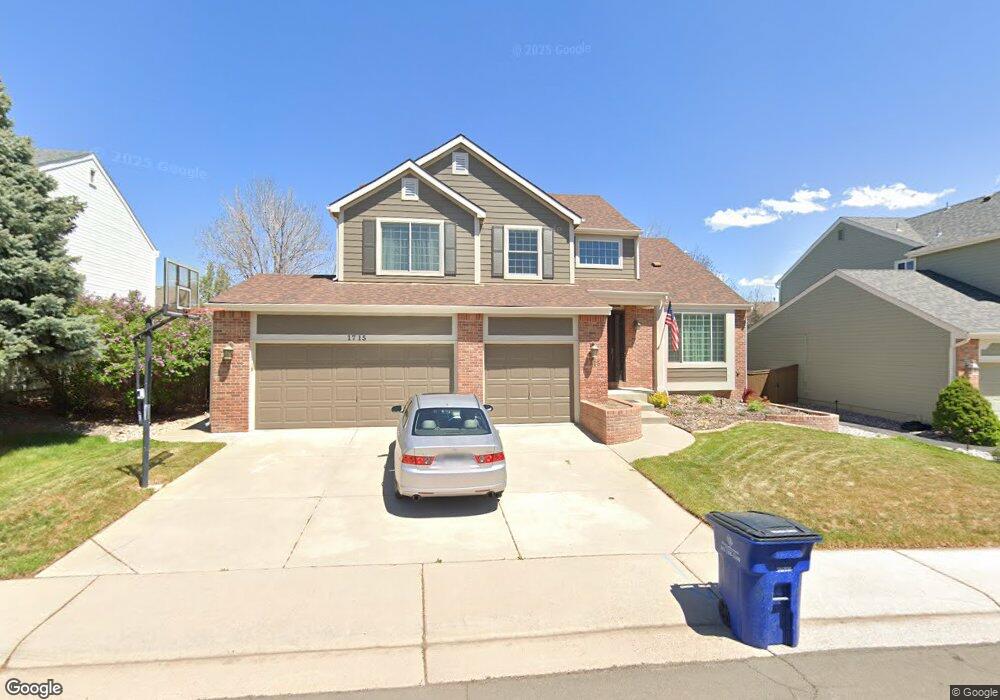
1715 Spring Water Place Highlands Ranch, CO 80129
Westridge NeighborhoodEstimated Value: $706,000 - $792,000
3
Beds
3
Baths
2,438
Sq Ft
$303/Sq Ft
Est. Value
About This Home
This home is located at 1715 Spring Water Place, Highlands Ranch, CO 80129 and is currently estimated at $739,652, approximately $303 per square foot. 1715 Spring Water Place is a home located in Douglas County with nearby schools including Coyote Creek Elementary School, Ranch View Middle School, and Thunderridge High School.
Ownership History
Date
Name
Owned For
Owner Type
Purchase Details
Closed on
May 29, 2001
Sold by
Spangenberg George E
Bought by
Suniga Rudolph P and Suniga Gloria
Current Estimated Value
Home Financials for this Owner
Home Financials are based on the most recent Mortgage that was taken out on this home.
Original Mortgage
$85,000
Outstanding Balance
$32,213
Interest Rate
7.07%
Estimated Equity
$707,439
Purchase Details
Closed on
Oct 15, 1999
Sold by
Grattan Patrick B and Grattan Barbara A
Bought by
Spangenberg George E
Home Financials for this Owner
Home Financials are based on the most recent Mortgage that was taken out on this home.
Original Mortgage
$176,000
Interest Rate
7.9%
Purchase Details
Closed on
Aug 29, 1997
Sold by
High View Homes Llc
Bought by
Grattan Patrick B and Grattan Barbara A
Home Financials for this Owner
Home Financials are based on the most recent Mortgage that was taken out on this home.
Original Mortgage
$135,000
Interest Rate
7.43%
Purchase Details
Closed on
Feb 27, 1997
Sold by
Mission Viejo Co
Bought by
High View Homes
Create a Home Valuation Report for This Property
The Home Valuation Report is an in-depth analysis detailing your home's value as well as a comparison with similar homes in the area
Home Values in the Area
Average Home Value in this Area
Purchase History
| Date | Buyer | Sale Price | Title Company |
|---|---|---|---|
| Suniga Rudolph P | $295,000 | Land Title Guarantee Company | |
| Spangenberg George E | $249,000 | -- | |
| Grattan Patrick B | $211,887 | Land Title | |
| High View Homes | $174,400 | -- |
Source: Public Records
Mortgage History
| Date | Status | Borrower | Loan Amount |
|---|---|---|---|
| Open | Suniga Rudolph P | $85,000 | |
| Previous Owner | Spangenberg George E | $176,000 | |
| Previous Owner | Grattan Patrick B | $135,000 |
Source: Public Records
Tax History Compared to Growth
Tax History
| Year | Tax Paid | Tax Assessment Tax Assessment Total Assessment is a certain percentage of the fair market value that is determined by local assessors to be the total taxable value of land and additions on the property. | Land | Improvement |
|---|---|---|---|---|
| 2024 | $3,622 | $48,820 | $12,430 | $36,390 |
| 2023 | $3,616 | $48,820 | $12,430 | $36,390 |
| 2022 | $2,748 | $37,030 | $9,050 | $27,980 |
| 2021 | $2,860 | $37,030 | $9,050 | $27,980 |
| 2020 | $2,727 | $36,550 | $8,250 | $28,300 |
| 2019 | $2,737 | $36,550 | $8,250 | $28,300 |
| 2018 | $2,346 | $32,020 | $7,880 | $24,140 |
| 2017 | $2,136 | $32,020 | $7,880 | $24,140 |
| 2016 | $1,950 | $30,200 | $7,650 | $22,550 |
| 2015 | $1,992 | $30,200 | $7,650 | $22,550 |
| 2014 | $1,701 | $25,510 | $6,210 | $19,300 |
Source: Public Records
Map
Nearby Homes
- 1864 Mountain Maple Ave
- 1993 Mountain Maple Ave
- 10473 Grizzly Gulch
- 1281 Riddlewood Rd
- 978 Sage Sparrow Cir
- 1113 Southbury Place
- 10347 Woodrose Ln
- 1660 Meyerwood Cir
- 10578 Hyacinth Ln
- 1086 Thornbury Place
- 10505 Hyacinth Place
- 885 Sage Sparrow Cir
- 1104 W Timbervale Trail
- 2627 Baneberry Ln
- 907 Riddlewood Ln
- 9755 Spring Hill St
- 1294 Braewood Ave
- 10060 Royal Eagle Ln
- 10544 Soulmark Way
- 664 Tiger Lily Way
- 1703 Spring Water Place
- 1729 Spring Water Place
- 1724 Spring Water Ln
- 1736 Spring Water Ln
- 1700 Spring Water Ln
- 1743 Spring Water Place
- 1716 Spring Water Place
- 1748 Spring Water Ln
- 1688 Spring Water Ln
- 1730 Spring Water Place
- 1704 Spring Water Place
- 1744 Spring Water Place
- 1760 Spring Water Ln
- 1673 Spring Water Place
- 1664 Spring Water Ln
- 1757 Spring Water Place
- 1686 Spring Water Place
- 1758 Spring Water Place
- 1772 Spring Water Ln
- 1652 Spring Water Ln