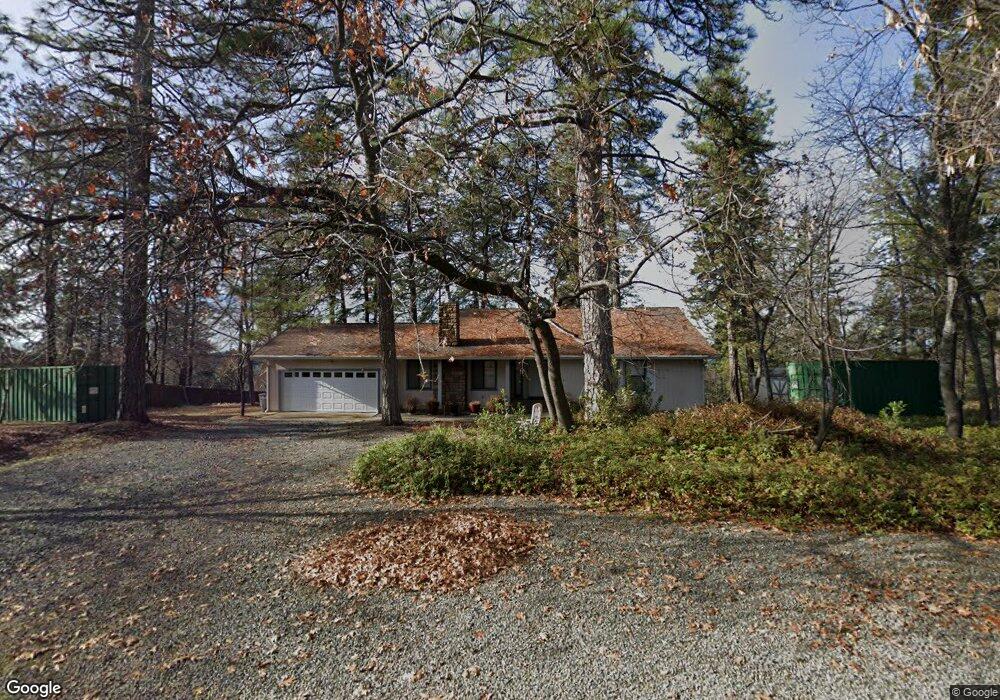
17151 Mountain View Dr Applegate, CA 95703
Estimated Value: $662,804 - $817,000
3
Beds
2
Baths
1,704
Sq Ft
$436/Sq Ft
Est. Value
About This Home
This home is located at 17151 Mountain View Dr, Applegate, CA 95703 and is currently estimated at $743,451, approximately $436 per square foot. 17151 Mountain View Dr is a home located in Placer County with nearby schools including Sierra Hills Elementary School, Weimar Hills, and Colfax High School.
Ownership History
Date
Name
Owned For
Owner Type
Purchase Details
Closed on
May 4, 2006
Sold by
Gregory Bruce
Bought by
Gregory Bruce S
Current Estimated Value
Home Financials for this Owner
Home Financials are based on the most recent Mortgage that was taken out on this home.
Original Mortgage
$275,500
Outstanding Balance
$158,644
Interest Rate
6.3%
Mortgage Type
Fannie Mae Freddie Mac
Estimated Equity
$584,807
Purchase Details
Closed on
May 2, 2006
Sold by
Ratzlaff Sherry Ann
Bought by
Gregory Bruce
Home Financials for this Owner
Home Financials are based on the most recent Mortgage that was taken out on this home.
Original Mortgage
$275,500
Outstanding Balance
$158,644
Interest Rate
6.3%
Mortgage Type
Fannie Mae Freddie Mac
Estimated Equity
$584,807
Purchase Details
Closed on
Aug 1, 2002
Sold by
Grether Carl F and Grether Ruth Irene
Bought by
Ratzlaff Sherry Ann
Create a Home Valuation Report for This Property
The Home Valuation Report is an in-depth analysis detailing your home's value as well as a comparison with similar homes in the area
Home Values in the Area
Average Home Value in this Area
Purchase History
| Date | Buyer | Sale Price | Title Company |
|---|---|---|---|
| Gregory Bruce S | -- | Alliance Title Company | |
| Gregory Bruce | $575,500 | Alliance Title Company | |
| Ratzlaff Sherry Ann | -- | -- |
Source: Public Records
Mortgage History
| Date | Status | Borrower | Loan Amount |
|---|---|---|---|
| Open | Gregory Bruce | $275,500 |
Source: Public Records
Tax History
| Year | Tax Paid | Tax Assessment Tax Assessment Total Assessment is a certain percentage of the fair market value that is determined by local assessors to be the total taxable value of land and additions on the property. | Land | Improvement |
|---|---|---|---|---|
| 2025 | $8,389 | $786,453 | $314,305 | $472,148 |
| 2023 | $8,389 | $755,916 | $302,101 | $453,815 |
| 2022 | $8,101 | $741,095 | $296,178 | $444,917 |
| 2021 | $7,920 | $726,565 | $290,371 | $436,194 |
| 2020 | $6,775 | $618,440 | $247,200 | $371,240 |
| 2019 | $6,712 | $613,364 | $245,100 | $368,264 |
| 2018 | $6,084 | $580,602 | $232,000 | $348,602 |
| 2017 | $5,833 | $555,666 | $222,100 | $333,566 |
| 2016 | $5,299 | $504,910 | $201,800 | $303,110 |
| 2015 | $4,709 | $452,000 | $180,600 | $271,400 |
| 2014 | $4,431 | $423,000 | $169,100 | $253,900 |
Source: Public Records
Map
Nearby Homes
- 90 Tall Pines Ct
- 419 Greenwood Dr
- 578 Greenwood Dr
- 1-Parcel Cuckoo Ct
- 170 Justin Ct
- 210 Meadow Gate Rd
- 795 Acorn Way
- 881 Livingston Rd
- 970 Mill Rd
- 1144 Boole Rd
- 780 Boole Rd
- 1325 Boole Rd
- 1274 Wooley Creek Ln
- 790 Pine Knoll Rd
- 1535 Whispering Pines Dr
- 0 Clipper Gap Rd Unit 226034546
- 18506 Dunvegan Dr
- 0 Heather Glen Dr
- 805 Country Rd
- 2611 Pinnacle View Dr
- 17171 Mountain View Dr
- 17121 Mountain View Dr
- 17150 Mountain View Dr
- 17101 Mountain View Dr
- 50 Tall Pines Ct
- 60 Tall Pines Ct
- 17081 Mountain View Dr
- 110 Pinecrest Dr
- 155 Vista Ridge Dr
- 140 Vista Ridge Dr
- 17080 Mountain View Dr
- 80 Tall Pines Ct
- 17061 Mountain View Dr
- 17050 Mountain View Dr
- 60 Pinecrest Dr
- 17031 Mountain View Dr
- 17020 Mountain View Dr
- 17105 Rocky Hills Ct
- 17199 Rocky Hills Ct
- 17130 Rocky Hills Ct
Your Personal Tour Guide
Ask me questions while you tour the home.