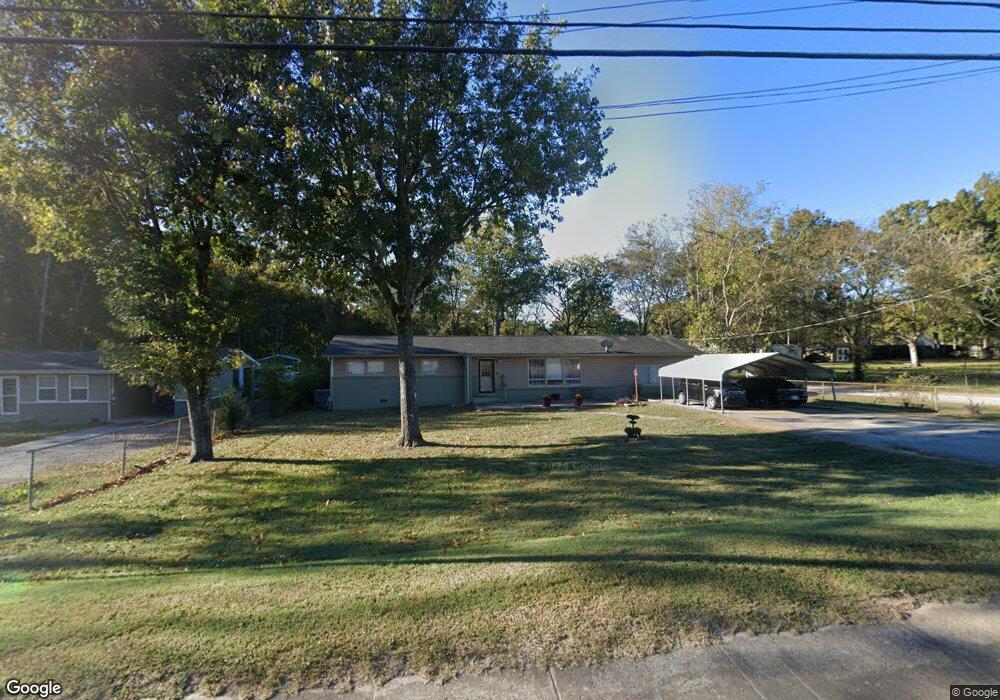
1716 Madison St Shelbyville, TN 37160
Estimated Value: $250,234 - $346,000
3
Beds
2
Baths
1,508
Sq Ft
$189/Sq Ft
Est. Value
About This Home
This home is located at 1716 Madison St, Shelbyville, TN 37160 and is currently estimated at $284,809, approximately $188 per square foot. 1716 Madison St is a home located in Bedford County with nearby schools including Harris Middle School and Victory Baptist Academy.
Ownership History
Date
Name
Owned For
Owner Type
Purchase Details
Closed on
Dec 11, 2019
Sold by
Whitaker Johnnie
Bought by
Farrar James
Current Estimated Value
Purchase Details
Closed on
Aug 15, 2018
Sold by
Webb Donna
Bought by
Webb Donna
Purchase Details
Closed on
Oct 13, 2003
Sold by
Amsouth Bank
Bought by
Whitaker Johnnie
Home Financials for this Owner
Home Financials are based on the most recent Mortgage that was taken out on this home.
Original Mortgage
$59,200
Interest Rate
6.16%
Purchase Details
Closed on
Oct 4, 2002
Sold by
Phillips Joseph
Bought by
Amsouth Bank
Purchase Details
Closed on
Sep 12, 2001
Sold by
Gannon Donald
Bought by
Beckett Steven and Beckett Tina
Home Financials for this Owner
Home Financials are based on the most recent Mortgage that was taken out on this home.
Original Mortgage
$84,053
Interest Rate
6.97%
Purchase Details
Closed on
Jun 16, 1988
Bought by
Gannon Donald
Purchase Details
Closed on
Jan 1, 1985
Bought by
Clardy Charlie M
Create a Home Valuation Report for This Property
The Home Valuation Report is an in-depth analysis detailing your home's value as well as a comparison with similar homes in the area
Home Values in the Area
Average Home Value in this Area
Purchase History
| Date | Buyer | Sale Price | Title Company |
|---|---|---|---|
| Farrar James | $45,541 | None Available | |
| Webb Donna | -- | None Available | |
| Whitaker Johnnie | $74,000 | -- | |
| Amsouth Bank | $76,500 | -- | |
| Beckett Steven | $84,033 | -- | |
| Gannon Donald | $51,000 | -- | |
| Clardy Charlie M | $30,700 | -- |
Source: Public Records
Mortgage History
| Date | Status | Borrower | Loan Amount |
|---|---|---|---|
| Previous Owner | Clardy Charlie M | $59,200 | |
| Previous Owner | Clardy Charlie M | $84,053 |
Source: Public Records
Tax History Compared to Growth
Tax History
| Year | Tax Paid | Tax Assessment Tax Assessment Total Assessment is a certain percentage of the fair market value that is determined by local assessors to be the total taxable value of land and additions on the property. | Land | Improvement |
|---|---|---|---|---|
| 2025 | -- | $35,400 | $0 | $0 |
| 2024 | -- | $35,400 | $4,700 | $30,700 |
| 2023 | $524 | $35,400 | $4,700 | $30,700 |
| 2022 | $1,386 | $35,400 | $4,700 | $30,700 |
| 2021 | $1,259 | $35,400 | $4,700 | $30,700 |
| 2020 | $1,096 | $35,400 | $4,700 | $30,700 |
| 2019 | $1,096 | $24,750 | $3,750 | $21,000 |
| 2018 | $1,072 | $24,750 | $3,750 | $21,000 |
| 2017 | $1,072 | $24,750 | $3,750 | $21,000 |
| 2016 | $1,062 | $24,750 | $3,750 | $21,000 |
| 2015 | $1,062 | $24,750 | $3,750 | $21,000 |
| 2014 | $990 | $25,254 | $0 | $0 |
Source: Public Records
Map
Nearby Homes
- 1683 Madison St
- 1404 Cypress St
- 204 S Hillcrest Dr
- 225 Eagle Blvd
- 1725 Wartrace Pike
- 705 S Wall St
- 707 S Wall St
- 2021 Madison St
- 207 Ledbetter Rd
- 711 S Wall St
- 719 S Wall St
- 715 S Wall St
- 713 S Wall St
- 404 Ledbetter Rd
- 104 Townsend Ave
- 218 Wall St
- 2212 Patricia Dr
- 104 Curbow Ct
- 148 Maupin Cir
- 0 Hwy 41a Hwy 64 E
- 1718 Madison St
- 122 Whispering Oak Dr
- 1712 Madison St
- 121 Whispering Oak Dr
- 120 Whispering Oak Dr
- 119 Whispering Oak Dr
- 1710 Madison St
- 118 Whispering Oak Dr
- 0 Stanley Blvd
- 117 Whispering Oak Dr
- 1708 Madison St
- 116 Whispering Oak Dr
- 103 Ligon Dr
- 115 Whispering Oak Dr
- 105 Ligon Dr
- 1805 Highway 41a N
- 114 Whispering Oak Dr
- 103 Whispering Oak Dr
- 105 Whispering Oak Dr
- 103 Whispering Oaks Dr