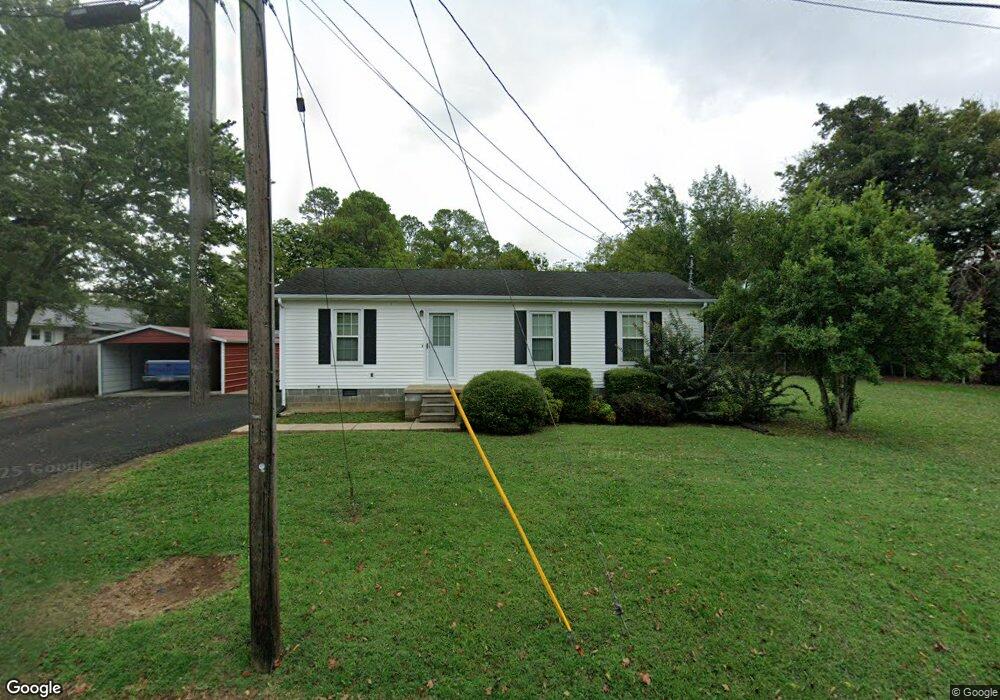
1716 Midland Rd Shelbyville, TN 37160
Estimated Value: $190,470 - $227,000
--
Bed
1
Bath
1,008
Sq Ft
$202/Sq Ft
Est. Value
About This Home
This home is located at 1716 Midland Rd, Shelbyville, TN 37160 and is currently estimated at $203,868, approximately $202 per square foot. 1716 Midland Rd is a home located in Bedford County with nearby schools including Eakin Elementary School, Harris Middle School, and Victory Baptist Academy.
Ownership History
Date
Name
Owned For
Owner Type
Purchase Details
Closed on
Mar 1, 2005
Sold by
Hardison Barbara A
Bought by
Coop Riley T
Current Estimated Value
Purchase Details
Closed on
Sep 29, 1994
Bought by
Parker Bobby
Purchase Details
Closed on
Jul 31, 1992
Bought by
Parker Bobby
Create a Home Valuation Report for This Property
The Home Valuation Report is an in-depth analysis detailing your home's value as well as a comparison with similar homes in the area
Home Values in the Area
Average Home Value in this Area
Purchase History
| Date | Buyer | Sale Price | Title Company |
|---|---|---|---|
| Coop Riley T | $58,500 | -- | |
| Parker Bobby | $44,500 | -- | |
| Parker Bobby | $2,600 | -- |
Source: Public Records
Tax History Compared to Growth
Tax History
| Year | Tax Paid | Tax Assessment Tax Assessment Total Assessment is a certain percentage of the fair market value that is determined by local assessors to be the total taxable value of land and additions on the property. | Land | Improvement |
|---|---|---|---|---|
| 2025 | -- | $25,800 | $0 | $0 |
| 2024 | -- | $25,800 | $4,375 | $21,425 |
| 2023 | $382 | $25,800 | $4,375 | $21,425 |
| 2022 | $1,010 | $25,800 | $4,375 | $21,425 |
| 2021 | $917 | $25,800 | $4,375 | $21,425 |
| 2020 | $736 | $25,800 | $4,375 | $21,425 |
| 2019 | $736 | $16,600 | $3,125 | $13,475 |
| 2018 | $719 | $16,600 | $3,125 | $13,475 |
| 2017 | $687 | $15,850 | $3,125 | $12,725 |
| 2016 | $680 | $15,850 | $3,125 | $12,725 |
| 2015 | $680 | $15,850 | $3,125 | $12,725 |
| 2014 | $596 | $15,213 | $0 | $0 |
Source: Public Records
Map
Nearby Homes
- 2315 U S 231
- 3124 U S 231
- 2290 Midland Rd Unit 7A
- 2290 Midland Rd Unit 8B
- 2290 Midland Rd Unit 4A
- 1931 Tennessee 82
- 1525 Green Ln
- 1523 Green Ln
- 108 Thoroughbred Blvd
- 1507 Green Ln
- 1505 Green Ln
- 201 Hickory Dr
- 0 Hwy 231 N
- 0 Archery Ln
- 321 Rolling Rd
- 323 Rolling Rd
- 114 Collier Ave
- 318 Meadow Dr
- 102 Greystone Way
- 1311 Glenoaks Rd
- 1719 Midland Rd
- 215 Moreland Ave
- 213 Moreland Ave
- 1717 Midland Rd
- 1721 Midland Rd
- 211 Moreland Ave
- 1723 Midland Rd
- 210 Moreland Ave
- 209 Moreland Ave
- 1803 Midland Rd
- 0 Midland Rd Green Ln Unit 1885518
- 208 Moreland Ave
- 1904 Midland Rd
- 206 Moreland Ave
- 1805 Midland Rd
- 207 Moreland Ave
- 204 Moreland Ave
- 1906 Midland Rd
- 1807 Midland Rd
- 200 Moreland Ave