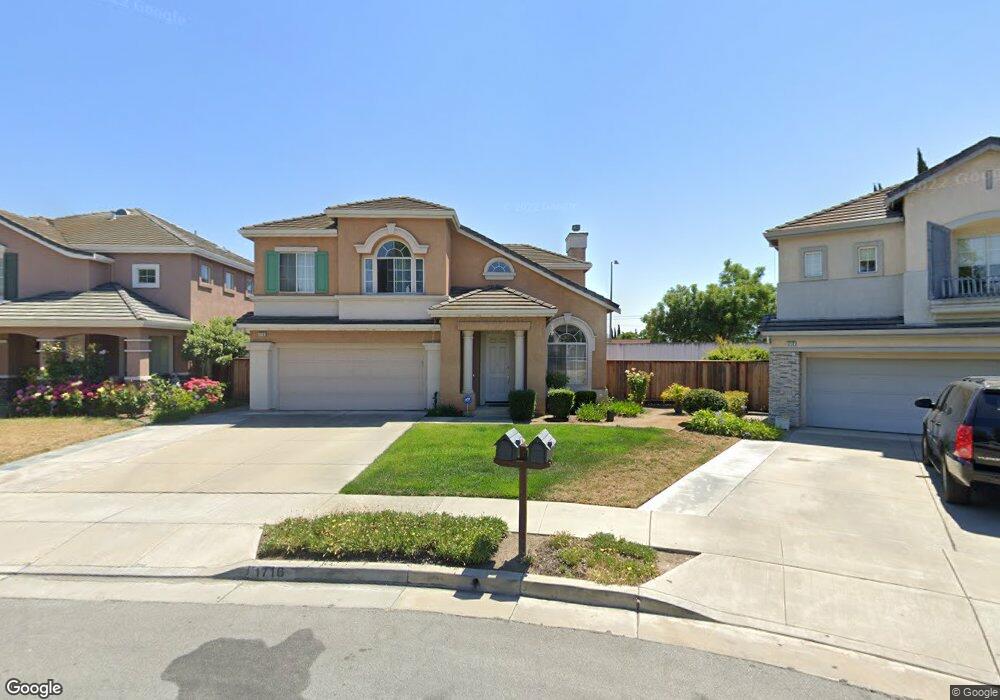
1716 Via Flores Ct San Jose, CA 95132
Estimated Value: $1,700,000 - $2,003,000
4
Beds
3
Baths
2,223
Sq Ft
$837/Sq Ft
Est. Value
About This Home
This home is located at 1716 Via Flores Ct, San Jose, CA 95132 and is currently estimated at $1,860,360, approximately $836 per square foot. 1716 Via Flores Ct is a home located in Santa Clara County with nearby schools including Northwood Elementary School, Morrill Middle School, and Independence High School.
Ownership History
Date
Name
Owned For
Owner Type
Purchase Details
Closed on
Jul 11, 2000
Sold by
Yum Kevin T and Mac Amanda T
Bought by
Yum Kevin T and Mac Amanda T
Current Estimated Value
Purchase Details
Closed on
Jul 20, 1999
Sold by
Phung Ngan
Bought by
Nham John
Home Financials for this Owner
Home Financials are based on the most recent Mortgage that was taken out on this home.
Original Mortgage
$371,000
Outstanding Balance
$104,578
Interest Rate
7.64%
Estimated Equity
$1,755,782
Create a Home Valuation Report for This Property
The Home Valuation Report is an in-depth analysis detailing your home's value as well as a comparison with similar homes in the area
Home Values in the Area
Average Home Value in this Area
Purchase History
| Date | Buyer | Sale Price | Title Company |
|---|---|---|---|
| Yum Kevin T | -- | -- | |
| Nham John | -- | First American Title Guarant | |
| Yum Kevin T | $464,000 | First American Title Co |
Source: Public Records
Mortgage History
| Date | Status | Borrower | Loan Amount |
|---|---|---|---|
| Open | Yum Kevin T | $371,000 |
Source: Public Records
Tax History Compared to Growth
Tax History
| Year | Tax Paid | Tax Assessment Tax Assessment Total Assessment is a certain percentage of the fair market value that is determined by local assessors to be the total taxable value of land and additions on the property. | Land | Improvement |
|---|---|---|---|---|
| 2025 | $10,271 | $713,056 | $230,533 | $482,523 |
| 2024 | $10,271 | $699,075 | $226,013 | $473,062 |
| 2023 | $10,083 | $685,369 | $221,582 | $463,787 |
| 2022 | $10,041 | $671,932 | $217,238 | $454,694 |
| 2021 | $9,714 | $658,758 | $212,979 | $445,779 |
| 2020 | $9,412 | $652,005 | $210,796 | $441,209 |
| 2019 | $9,053 | $639,221 | $206,663 | $432,558 |
| 2018 | $8,923 | $626,688 | $202,611 | $424,077 |
| 2017 | $8,974 | $614,401 | $198,639 | $415,762 |
| 2016 | $8,600 | $602,355 | $194,745 | $407,610 |
| 2015 | $8,499 | $593,308 | $191,820 | $401,488 |
| 2014 | $7,799 | $581,687 | $188,063 | $393,624 |
Source: Public Records
Map
Nearby Homes
- 1693 Peachwood Dr
- 1898 Anne Marie Ct
- 1690 Coraltree Place
- 2200 Beech Cir
- 2625 Autumnvale Dr
- 2158 Capitol Park Ct
- 1827 Flickinger Ave
- 2280 Zoria Cir
- 2924 Via Encinitas
- 1599 Clampett Way
- 2075 Lakewood Dr
- 2210 Renfrew Ct
- 1756 Valhalla Ct
- 1982 Plaza Montez
- 2790 Longford Dr
- 1332 Cabrillo Ave
- 2129 Doxey Dr
- 1879 Passage St
- 2036 Tarob Ct
- Odin Plan at Parkside West
- 1720 Via Flores Ct
- 1712 Via Flores Ct
- 1724 Via Flores Ct
- 1708 Via Flores Ct
- 1704 Via Flores Ct
- 1751 Via Flores Ct
- 1728 Via Flores Ct
- 1776 Via Cinco de Mayo
- 1772 Via Cinco de Mayo
- 1780 Via Cinco de Mayo
- 1746 Oldtree Ct
- 1755 Via Flores Ct
- 1732 Via Flores Ct
- 1748 Oldtree Ct Unit 1
- 1748 Oldtree Ct
- 1742 Oldtree Ct
- 1738 Oldtree Ct
- 1736 Via Flores Ct
- 1740 Via Flores Ct
- 1744 Via Flores Ct