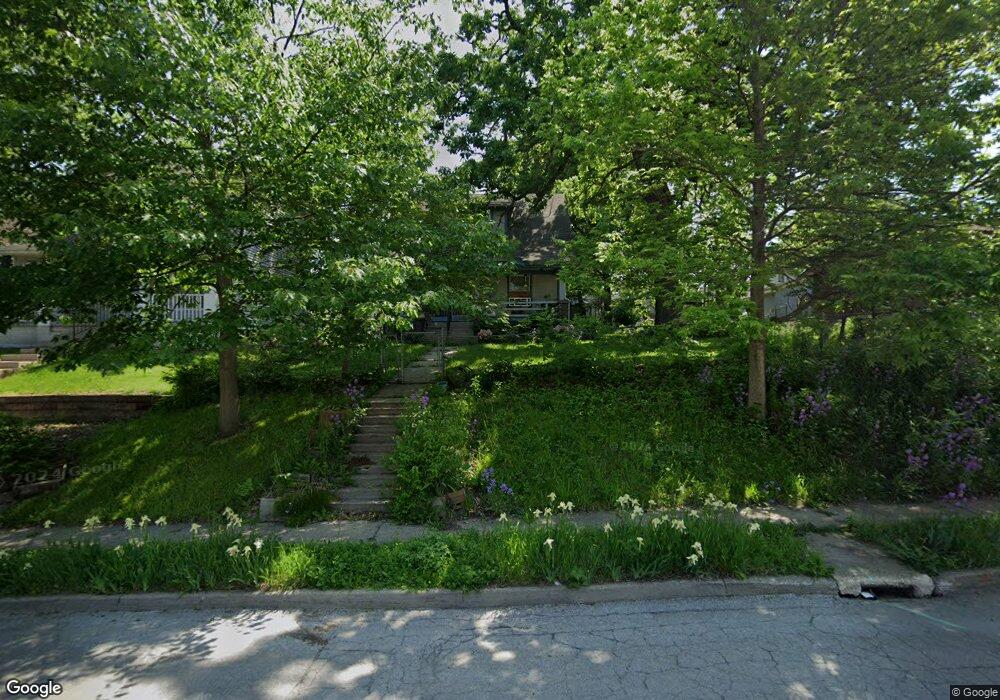
1717 13th St Des Moines, IA 50314
King Irving NeighborhoodEstimated Value: $131,000 - $190,000
3
Beds
1
Bath
1,359
Sq Ft
$111/Sq Ft
Est. Value
About This Home
This home is located at 1717 13th St, Des Moines, IA 50314 and is currently estimated at $150,658, approximately $110 per square foot. 1717 13th St is a home located in Polk County with nearby schools including Moulton Elementary School, Harding Middle School, and North High School.
Ownership History
Date
Name
Owned For
Owner Type
Purchase Details
Closed on
Jul 21, 1998
Sold by
Meade Jo A
Bought by
Lass William T and Meade Jo A
Current Estimated Value
Home Financials for this Owner
Home Financials are based on the most recent Mortgage that was taken out on this home.
Original Mortgage
$33,600
Interest Rate
7.13%
Create a Home Valuation Report for This Property
The Home Valuation Report is an in-depth analysis detailing your home's value as well as a comparison with similar homes in the area
Home Values in the Area
Average Home Value in this Area
Purchase History
| Date | Buyer | Sale Price | Title Company |
|---|---|---|---|
| Lass William T | -- | -- |
Source: Public Records
Mortgage History
| Date | Status | Borrower | Loan Amount |
|---|---|---|---|
| Closed | Lass William T | $33,600 |
Source: Public Records
Tax History
| Year | Tax Paid | Tax Assessment Tax Assessment Total Assessment is a certain percentage of the fair market value that is determined by local assessors to be the total taxable value of land and additions on the property. | Land | Improvement |
|---|---|---|---|---|
| 2025 | $1,482 | $108,000 | $16,300 | $91,700 |
| 2024 | $1,482 | $92,800 | $13,900 | $78,900 |
| 2023 | $1,392 | $92,800 | $13,900 | $78,900 |
| 2022 | $1,378 | $67,900 | $10,600 | $57,300 |
| 2021 | $1,276 | $67,900 | $10,600 | $57,300 |
| 2020 | $1,320 | $59,700 | $9,400 | $50,300 |
| 2019 | $1,224 | $59,700 | $9,400 | $50,300 |
| 2018 | $1,208 | $54,100 | $8,400 | $45,700 |
| 2017 | $1,236 | $54,100 | $8,400 | $45,700 |
| 2016 | $1,198 | $54,200 | $8,400 | $45,800 |
| 2015 | $1,198 | $54,200 | $8,400 | $45,800 |
| 2014 | $1,140 | $51,600 | $8,800 | $42,800 |
Source: Public Records
Map
Nearby Homes
- 1821 12th St
- 1616 11th St
- 1806 10th St
- 1711 10th St
- 1412 Chautauqua Pkwy
- 1503 13th St
- 1510 11th St
- 1534 9th St
- 1816 8th St
- 2009 10th St
- 1615 Jefferson Ave
- 1404 Burlington Terrace
- 1617 College Ave
- 717 Franklin Ave
- 1501 9th St
- 1515 Harrison Ave
- 1716 Mondamin Ave
- 1414 Harrison Ave
- 1825 7th St
- 1727 Mondamin Ave
Your Personal Tour Guide
Ask me questions while you tour the home.