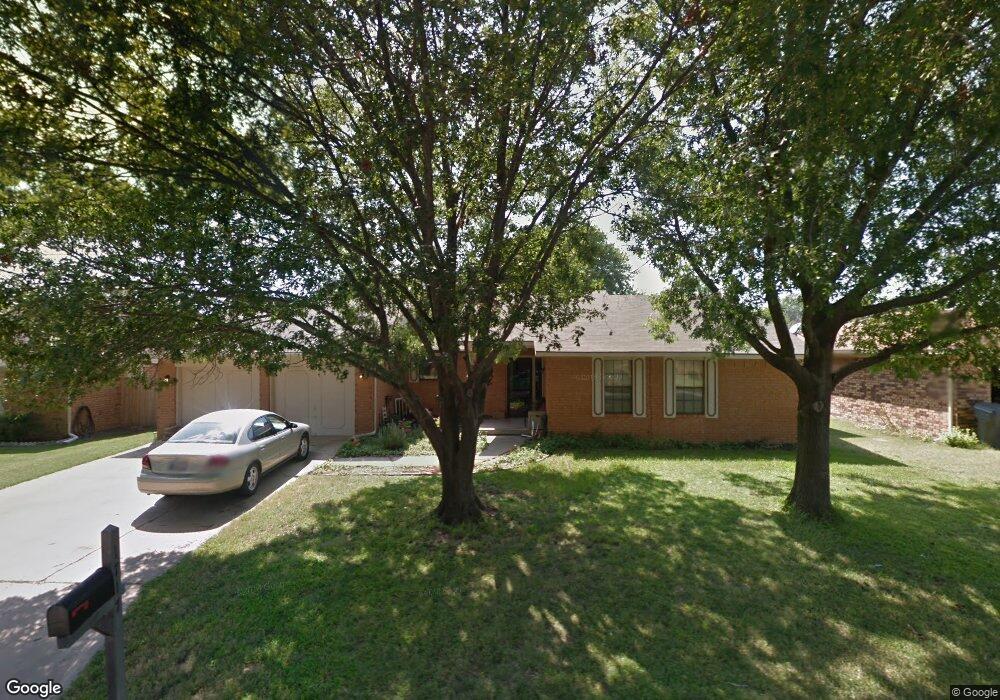
1717 Floyd Rd Ardmore, OK 73401
Estimated Value: $211,000 - $260,000
3
Beds
2
Baths
1,688
Sq Ft
$134/Sq Ft
Est. Value
About This Home
This home is located at 1717 Floyd Rd, Ardmore, OK 73401 and is currently estimated at $226,160, approximately $133 per square foot. 1717 Floyd Rd is a home located in Carter County with nearby schools including Charles Evans Elementary School, Ardmore Middle School, and Ardmore High School.
Ownership History
Date
Name
Owned For
Owner Type
Purchase Details
Closed on
Oct 16, 2023
Sold by
Doss Annette
Bought by
Cervantes Jenifer and Cervantes Rigoberto
Current Estimated Value
Purchase Details
Closed on
Jun 26, 2007
Sold by
Hair Virginia Schuiterna
Bought by
Stephenson Ethel Elaine and Stephenson Charles R
Home Financials for this Owner
Home Financials are based on the most recent Mortgage that was taken out on this home.
Original Mortgage
$143,553
Interest Rate
6.19%
Mortgage Type
VA
Purchase Details
Closed on
Jun 25, 2007
Sold by
Stephenson Ethel Elaine and Stephenson Charles R
Bought by
Jones Timothy S and Jones Cheryl Washburn
Home Financials for this Owner
Home Financials are based on the most recent Mortgage that was taken out on this home.
Original Mortgage
$143,553
Interest Rate
6.19%
Mortgage Type
VA
Purchase Details
Closed on
Nov 23, 2004
Sold by
Dement Ira H and Dement Norma J
Bought by
Stephenson Ethel Elaine and Stephenson Charles R
Purchase Details
Closed on
Oct 2, 1995
Sold by
Dement Robert E
Bought by
Dement Ira H and Dement Norma
Create a Home Valuation Report for This Property
The Home Valuation Report is an in-depth analysis detailing your home's value as well as a comparison with similar homes in the area
Purchase History
| Date | Buyer | Sale Price | Title Company |
|---|---|---|---|
| Cervantes Jenifer | $8,000 | None Listed On Document | |
| Stephenson Ethel Elaine | -- | -- | |
| Jones Timothy S | $137,666 | -- | |
| Stephenson Ethel Elaine | -- | -- | |
| Dement Ira H | -- | -- |
Source: Public Records
Mortgage History
| Date | Status | Borrower | Loan Amount |
|---|---|---|---|
| Previous Owner | Jones Timothy S | $143,553 |
Source: Public Records
Tax History
| Year | Tax Paid | Tax Assessment Tax Assessment Total Assessment is a certain percentage of the fair market value that is determined by local assessors to be the total taxable value of land and additions on the property. | Land | Improvement |
|---|---|---|---|---|
| 2025 | $1,390 | $14,929 | $1,939 | $12,990 |
| 2024 | $1,391 | $14,494 | $1,882 | $12,612 |
| 2023 | $1,347 | $14,072 | $1,859 | $12,213 |
| 2022 | $1,210 | $13,661 | $1,831 | $11,830 |
| 2021 | $1,237 | $13,264 | $1,805 | $11,459 |
| 2020 | $1,181 | $12,878 | $1,731 | $11,147 |
| 2019 | $1,117 | $12,502 | $2,114 | $10,388 |
| 2018 | $1,100 | $12,139 | $1,221 | $10,918 |
| 2017 | $986 | $11,785 | $1,176 | $10,609 |
| 2016 | $973 | $11,442 | $1,115 | $10,327 |
| 2015 | $777 | $11,108 | $842 | $10,266 |
| 2014 | $875 | $10,784 | $842 | $9,942 |
Source: Public Records
Map
Nearby Homes
- 11 Turner St
- 111 Lost Creek Ln
- 1618 Mount Washington Rd
- 1737 Winchester St
- 412 Wandering Way
- 1740 Tiverton St
- 1722 Quiet Ln
- 421 Elm St
- 45 15th Ave NW
- 205 15th Ave NW
- 414 Locust St
- 1409 Mount Washington Rd
- 434 Locust St NW
- 1415 Holt St
- 510 Campbell St
- 0 15th Unit 2546881
- 230 13th Ave NW
- 525 Cottonwood St
- 600 Cottonwood St
- 0 Hometown Rd Unit 2607656
Your Personal Tour Guide
Ask me questions while you tour the home.