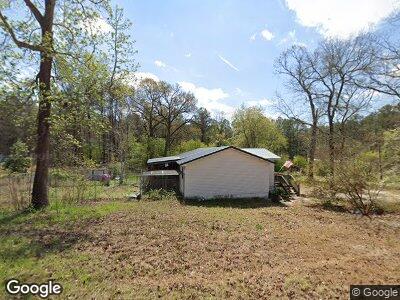
1717 McCords Ferry Rd Eastover, SC 29044
Estimated Value: $72,000 - $138,977
2
Beds
1
Bath
874
Sq Ft
$126/Sq Ft
Est. Value
About This Home
This home is located at 1717 McCords Ferry Rd, Eastover, SC 29044 and is currently estimated at $109,744, approximately $125 per square foot. 1717 McCords Ferry Rd is a home located in Richland County with nearby schools including Southeast Middle School and Lower Richland High School.
Ownership History
Date
Name
Owned For
Owner Type
Purchase Details
Closed on
Sep 17, 2004
Sold by
Willingham T M
Bought by
Sanderson Tracy A
Current Estimated Value
Home Financials for this Owner
Home Financials are based on the most recent Mortgage that was taken out on this home.
Original Mortgage
$53,657
Outstanding Balance
$27,577
Interest Rate
5.92%
Mortgage Type
FHA
Estimated Equity
$75,425
Purchase Details
Closed on
Sep 28, 2000
Sold by
Bankers Trust Company Na
Bought by
Willingham T M
Purchase Details
Closed on
Oct 26, 1999
Sold by
Wilson Chester A
Bought by
Bankers Trust Company California Na
Purchase Details
Closed on
Aug 12, 1998
Sold by
Lee David L
Bought by
Wilson Chester
Home Financials for this Owner
Home Financials are based on the most recent Mortgage that was taken out on this home.
Original Mortgage
$44,000
Interest Rate
6.91%
Create a Home Valuation Report for This Property
The Home Valuation Report is an in-depth analysis detailing your home's value as well as a comparison with similar homes in the area
Home Values in the Area
Average Home Value in this Area
Purchase History
| Date | Buyer | Sale Price | Title Company |
|---|---|---|---|
| Sanderson Tracy A | $54,500 | -- | |
| Willingham T M | $26,000 | -- | |
| Bankers Trust Company California Na | $2,500 | -- | |
| Wilson Chester | $31,233 | -- |
Source: Public Records
Mortgage History
| Date | Status | Borrower | Loan Amount |
|---|---|---|---|
| Open | Sanderson Tracy A | $53,657 | |
| Previous Owner | Wilson Chester | $44,000 | |
| Closed | Sanderson Tracy A | $1,000 |
Source: Public Records
Tax History Compared to Growth
Tax History
| Year | Tax Paid | Tax Assessment Tax Assessment Total Assessment is a certain percentage of the fair market value that is determined by local assessors to be the total taxable value of land and additions on the property. | Land | Improvement |
|---|---|---|---|---|
| 2024 | $806 | $66,700 | $0 | $0 |
| 2023 | $806 | $2,320 | $0 | $0 |
| 2022 | $732 | $58,000 | $6,900 | $51,100 |
| 2021 | $717 | $2,320 | $0 | $0 |
| 2020 | $725 | $2,320 | $0 | $0 |
| 2019 | $694 | $2,320 | $0 | $0 |
| 2018 | $612 | $2,020 | $0 | $0 |
| 2017 | $602 | $2,020 | $0 | $0 |
| 2016 | $600 | $2,020 | $0 | $0 |
| 2015 | $588 | $2,020 | $0 | $0 |
| 2014 | $575 | $50,400 | $0 | $0 |
| 2013 | -- | $2,020 | $0 | $0 |
Source: Public Records
Map
Nearby Homes
- 0 Westvaco Rd
- 1230 Goffman Rd
- 3000 Screaming Eagle Road Extension
- 128 Dogwood Shores Ln
- 126 Dogwood Shores Ln
- 2000 Oak Hill Rd
- 125 Meadow Ln
- 10 Leesberry Ct
- 573 Beaver Hut Trail
- 0 Eastover Rd Unit 565873
- 444 Eastover Rd
- 1758 Baughman Rd
- 1508 Congress Rd Unit Lot 2
- 1508 Congress Rd Unit Lot 3
- 1508 Congress Rd Unit Lot 1
- 250 Raglins Way
- 408 Raglins Way
- 388 Raglins Way
- 402 Raglins Way
- 230 Raglins Way
- 1717 McCords Ferry Rd
- 1719 McCords Ferry Rd
- 1721 McCords Ferry Rd
- 1723 McCords Ferry Rd
- 1727 McCords Ferry Rd
- 1687 McCords Ferry Rd
- 1735 McCords Ferry Rd
- 1685 McCords Ferry Rd
- 1731 McCords Ferry Rd
- 1741 McCords Ferry Rd
- 1683 McCords Ferry Rd
- 1749 McCords Ferry Rd
- 111 Sylvia Stepp Ln
- 1027 Old McGraw Rd
- 110 Sylvia Stepp Ln
- 120 Sylvia Stepp Ln
- 1023 Old McGraw Rd
- 1017 Old McGraw Rd
- 1681 McCords Ferry Rd
- 120 Lucille Robinson Rd