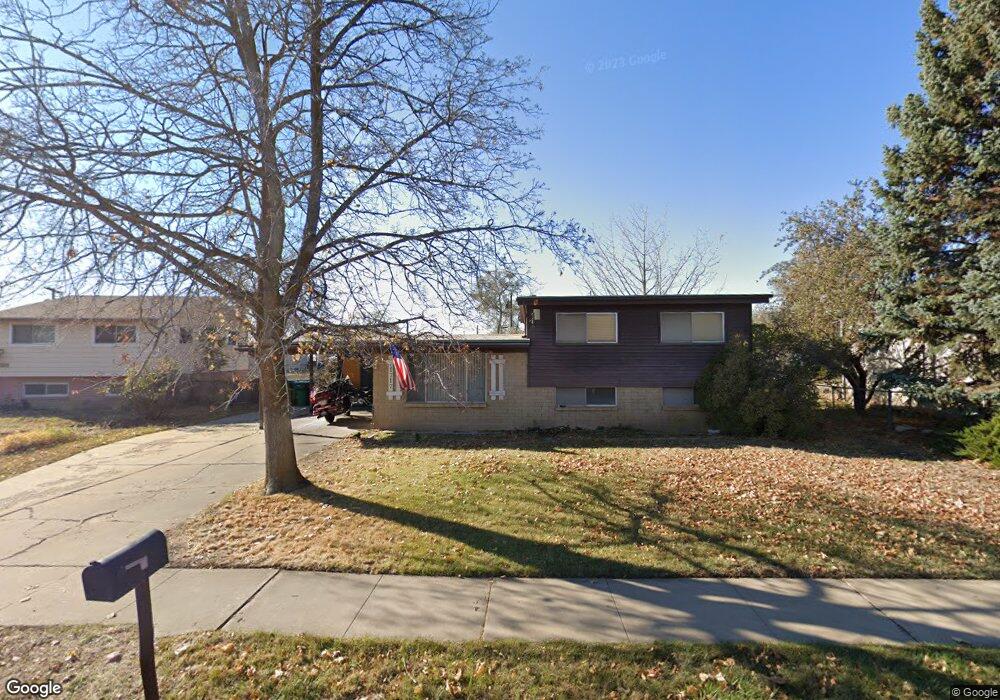
1717 N Afton Cir Layton, UT 84041
Estimated Value: $352,000 - $382,655
3
Beds
1
Bath
1,504
Sq Ft
$245/Sq Ft
Est. Value
About This Home
This home is located at 1717 N Afton Cir, Layton, UT 84041 and is currently estimated at $369,164, approximately $245 per square foot. 1717 N Afton Cir is a home located in Davis County with nearby schools including Vae View Elementary School, Central Davis Junior High School, and Layton High School.
Ownership History
Date
Name
Owned For
Owner Type
Purchase Details
Closed on
Feb 22, 2006
Sold by
Onstad Robin Matthew
Bought by
Petersen Roger and Petersen Michelle
Current Estimated Value
Home Financials for this Owner
Home Financials are based on the most recent Mortgage that was taken out on this home.
Original Mortgage
$22,240
Outstanding Balance
$12,483
Interest Rate
6.15%
Mortgage Type
Stand Alone Second
Estimated Equity
$356,681
Purchase Details
Closed on
Feb 21, 2006
Sold by
Onstad Roger Mark
Bought by
Petersen Roger and Petersen Michelle
Home Financials for this Owner
Home Financials are based on the most recent Mortgage that was taken out on this home.
Original Mortgage
$22,240
Outstanding Balance
$12,483
Interest Rate
6.15%
Mortgage Type
Stand Alone Second
Estimated Equity
$356,681
Purchase Details
Closed on
May 24, 2005
Sold by
Onstad Roger Mark
Bought by
Onstad Roger Mark and Onstad Robin Matthew
Create a Home Valuation Report for This Property
The Home Valuation Report is an in-depth analysis detailing your home's value as well as a comparison with similar homes in the area
Home Values in the Area
Average Home Value in this Area
Purchase History
| Date | Buyer | Sale Price | Title Company |
|---|---|---|---|
| Petersen Roger | -- | None Available | |
| Petersen Roger | -- | None Available | |
| Onstad Roger Mark | -- | -- |
Source: Public Records
Mortgage History
| Date | Status | Borrower | Loan Amount |
|---|---|---|---|
| Open | Petersen Roger | $22,240 | |
| Open | Petersen Roger | $88,960 | |
| Closed | Petersen Roger | $88,960 |
Source: Public Records
Tax History Compared to Growth
Tax History
| Year | Tax Paid | Tax Assessment Tax Assessment Total Assessment is a certain percentage of the fair market value that is determined by local assessors to be the total taxable value of land and additions on the property. | Land | Improvement |
|---|---|---|---|---|
| 2025 | $1,719 | $180,400 | $121,624 | $58,776 |
| 2024 | $1,685 | $178,200 | $144,805 | $33,395 |
| 2023 | $1,631 | $304,000 | $176,330 | $127,670 |
| 2022 | $1,750 | $177,100 | $85,596 | $91,504 |
| 2021 | $1,616 | $244,000 | $126,057 | $117,943 |
| 2020 | $1,340 | $194,000 | $95,209 | $98,791 |
| 2019 | $1,333 | $189,000 | $91,550 | $97,450 |
| 2018 | $1,159 | $165,000 | $84,769 | $80,231 |
| 2016 | $1,004 | $73,755 | $23,247 | $50,508 |
| 2015 | $964 | $67,210 | $23,247 | $43,963 |
| 2014 | $908 | $64,776 | $23,247 | $41,529 |
| 2013 | -- | $74,086 | $21,735 | $52,351 |
Source: Public Records
Map
Nearby Homes
- 1740 N Gregory Dr
- 1992 W Afton Cir
- 1954 Ann St
- 1916 W Gregory Dr
- 1937 W 1620 N
- 2114 S 825 E
- 1430 N 2100 W
- 1596 N Main St Unit 2
- 1491 N 1875 W
- 1491 N 1875 W Unit 158
- 1487 N 1875 W
- 1487 N 1875 W Unit 159
- 1483 N 1875 W
- 1476 N 1875 W Unit 164
- 1479 N 1875 W
- 1479 N 1875 W Unit 161
- 1463 N 1875 W Unit 165
- 1463 N 1875 W
- 1459 N 1875 W
- 1459 N 1875 W Unit 166
- 1701 N Afton Cir
- 1725 N Afton Cir
- 2075 Clara St
- 2085 Clara St
- 2029 Clara St
- 2027 W Afton Cir
- 1710 N Celia Way
- 1708 N Afton Cir
- 1700 N Celia Way
- 2099 Clara St
- 1716 N Afton Cir
- 1694 N Celia Way
- 2019 W Afton Cir
- 1728 N Afton Cir
- 914 S 2075 W
- 2004 W Afton Cir
- 1680 N Celia Way
- 1732 N Celia Way
- 2007 W Afton Cir
- 1752 N Mark St