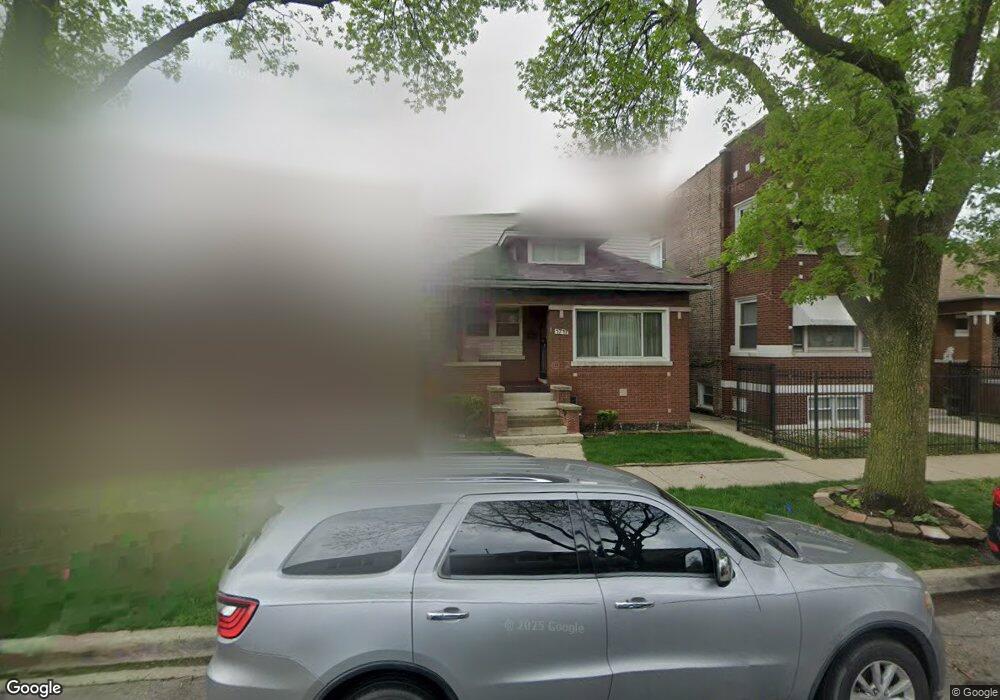
1717 N Lorel Ave Chicago, IL 60639
Austin NeighborhoodEstimated Value: $177,000 - $307,749
3
Beds
2
Baths
966
Sq Ft
$277/Sq Ft
Est. Value
About This Home
This home is located at 1717 N Lorel Ave, Chicago, IL 60639 and is currently estimated at $267,437, approximately $276 per square foot. 1717 N Lorel Ave is a home located in Cook County with nearby schools including Lewis Elementary School, Foreman College and Career Academy, and Christopher House.
Ownership History
Date
Name
Owned For
Owner Type
Purchase Details
Closed on
Nov 25, 2009
Sold by
Henley Joseph and Henley Genetta
Bought by
Henley Genetta
Current Estimated Value
Purchase Details
Closed on
Feb 1, 2003
Sold by
White Loriann and Henley Joseph
Bought by
Henley Joseph
Home Financials for this Owner
Home Financials are based on the most recent Mortgage that was taken out on this home.
Original Mortgage
$101,400
Outstanding Balance
$43,384
Interest Rate
6.06%
Estimated Equity
$224,053
Purchase Details
Closed on
Dec 30, 2002
Sold by
White Loriann
Bought by
White Loriann and Henley Joseph
Home Financials for this Owner
Home Financials are based on the most recent Mortgage that was taken out on this home.
Original Mortgage
$101,400
Outstanding Balance
$43,384
Interest Rate
6.06%
Estimated Equity
$224,053
Purchase Details
Closed on
Dec 28, 1998
Sold by
Townsend Barbara
Bought by
White Loriann
Home Financials for this Owner
Home Financials are based on the most recent Mortgage that was taken out on this home.
Original Mortgage
$72,900
Interest Rate
10.75%
Create a Home Valuation Report for This Property
The Home Valuation Report is an in-depth analysis detailing your home's value as well as a comparison with similar homes in the area
Home Values in the Area
Average Home Value in this Area
Purchase History
| Date | Buyer | Sale Price | Title Company |
|---|---|---|---|
| Henley Genetta | -- | Stc | |
| Henley Joseph | -- | -- | |
| White Loriann | -- | Prairie Title | |
| White Loriann | $81,000 | -- |
Source: Public Records
Mortgage History
| Date | Status | Borrower | Loan Amount |
|---|---|---|---|
| Open | White Loriann | $101,400 | |
| Closed | White Loriann | $72,900 |
Source: Public Records
Tax History Compared to Growth
Tax History
| Year | Tax Paid | Tax Assessment Tax Assessment Total Assessment is a certain percentage of the fair market value that is determined by local assessors to be the total taxable value of land and additions on the property. | Land | Improvement |
|---|---|---|---|---|
| 2024 | $2,117 | $21,001 | $6,938 | $14,063 |
| 2023 | $2,025 | $16,000 | $5,625 | $10,375 |
| 2022 | $2,025 | $16,000 | $5,625 | $10,375 |
| 2021 | $1,190 | $16,000 | $5,625 | $10,375 |
| 2020 | $1,228 | $14,708 | $4,125 | $10,583 |
| 2019 | $1,224 | $16,343 | $4,125 | $12,218 |
| 2018 | $1,205 | $16,343 | $4,125 | $12,218 |
| 2017 | $1,291 | $14,918 | $3,750 | $11,168 |
| 2016 | $1,698 | $14,918 | $3,750 | $11,168 |
| 2015 | $1,632 | $14,918 | $3,750 | $11,168 |
| 2014 | $1,618 | $13,434 | $3,375 | $10,059 |
| 2013 | $1,623 | $13,434 | $3,375 | $10,059 |
Source: Public Records
Map
Nearby Homes
- 1735 N Latrobe Ave
- 5241 W Galewood Ave
- 5309 W Galewood Ave
- 5215 W Galewood Ave
- 5323 W Galewood Ave
- 5321 W Galewood Ave
- 5317 W Galewood Ave
- 5217 W Galewood Ave
- 5213 W Galewood Ave
- 5211 W Galewood Ave
- 5311 W Galewood Ave
- 5251 W Galewood Ave
- 5307 W Galewood Ave
- 5249 W Galewood Ave
- 5247 W Galewood Ave
- 1906 N Lockwood Ave
- 1911 N Lorel Ave
- 1916 N Long Ave
- 1918 N Long Ave
- 1920 N Long Ave
- 1715 N Lorel Ave
- 1715 N Lorel Ave
- 1719 N Lorel Ave
- 1723 N Lorel Ave
- 1711 N Lorel Ave
- 1707 N Lorel Ave
- 1725 N Lorel Ave
- 1705 N Lorel Ave
- 1729 N Lorel Ave
- 1716 N Lockwood Ave
- 1718 N Lockwood Ave
- 1701 N Lorel Ave
- 1720 N Lockwood Ave
- 1731 N Lorel Ave
- 1731 N Lorel Ave
- 1710 N Lockwood Ave
- 1724 N Lockwood Ave
- 1706 N Lockwood Ave
- 1712 N Lockwood Ave
- 1728 N Lockwood Ave