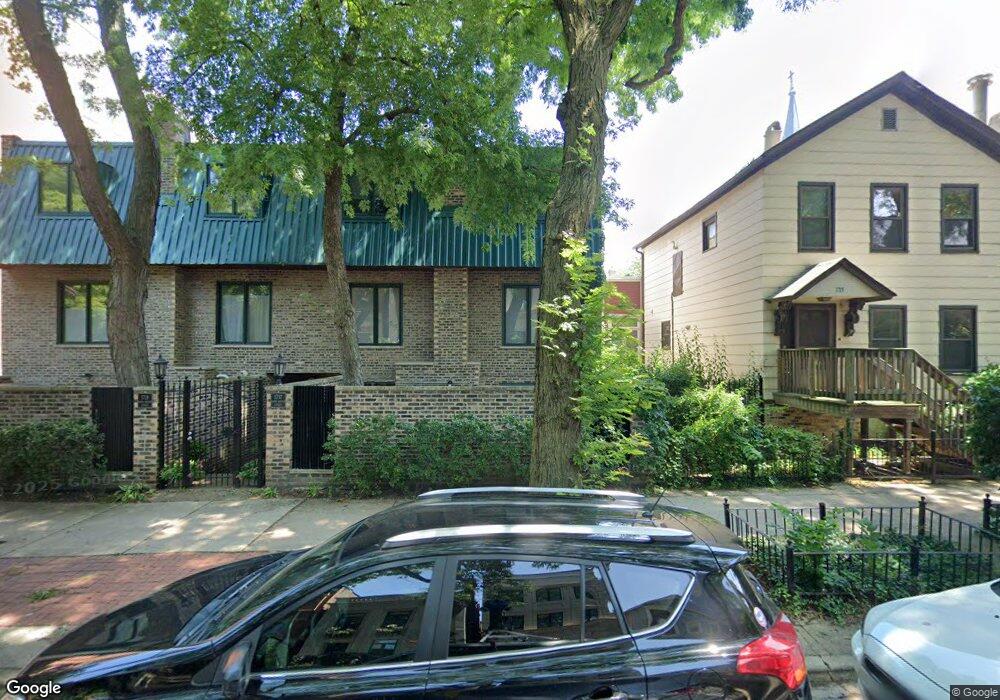
1717 N Mohawk St Chicago, IL 60614
Old Town NeighborhoodEstimated Value: $545,443 - $617,000
1
Bed
1
Bath
936
Sq Ft
$628/Sq Ft
Est. Value
About This Home
This home is located at 1717 N Mohawk St, Chicago, IL 60614 and is currently estimated at $587,611, approximately $627 per square foot. 1717 N Mohawk St is a home located in Cook County with nearby schools including Abraham Lincoln Elementary School, Lincoln Park High School, and Immaculate Conception - St. Joseph School.
Ownership History
Date
Name
Owned For
Owner Type
Purchase Details
Closed on
Apr 10, 2018
Sold by
Iwaoka Carol A
Bought by
Zhu Li
Current Estimated Value
Home Financials for this Owner
Home Financials are based on the most recent Mortgage that was taken out on this home.
Original Mortgage
$160,000
Outstanding Balance
$43,222
Interest Rate
3.99%
Mortgage Type
New Conventional
Estimated Equity
$544,389
Purchase Details
Closed on
Dec 15, 1998
Sold by
Rose William L and Rose Elizabeth K
Bought by
Iwaoka Carol A
Home Financials for this Owner
Home Financials are based on the most recent Mortgage that was taken out on this home.
Original Mortgage
$182,500
Interest Rate
6.96%
Purchase Details
Closed on
Apr 30, 1996
Sold by
Kenney Crane H and Kenney Kelly C
Bought by
Rose William L and Rose Elizabeth K
Home Financials for this Owner
Home Financials are based on the most recent Mortgage that was taken out on this home.
Original Mortgage
$180,000
Interest Rate
7.86%
Create a Home Valuation Report for This Property
The Home Valuation Report is an in-depth analysis detailing your home's value as well as a comparison with similar homes in the area
Home Values in the Area
Average Home Value in this Area
Purchase History
| Date | Buyer | Sale Price | Title Company |
|---|---|---|---|
| Zhu Li | $420,000 | Liberty Title & Escrow Com | |
| Iwaoka Carol A | $238,500 | Plm Title Company | |
| Rose William L | $200,000 | 1St American Title |
Source: Public Records
Mortgage History
| Date | Status | Borrower | Loan Amount |
|---|---|---|---|
| Open | Zhu Li | $160,000 | |
| Previous Owner | Iwaoka Carol A | $182,500 | |
| Previous Owner | Rose William L | $180,000 |
Source: Public Records
Tax History
| Year | Tax Paid | Tax Assessment Tax Assessment Total Assessment is a certain percentage of the fair market value that is determined by local assessors to be the total taxable value of land and additions on the property. | Land | Improvement |
|---|---|---|---|---|
| 2025 | $9,217 | $52,001 | $13,594 | $38,407 |
| 2024 | $9,217 | $52,001 | $13,594 | $38,407 |
| 2023 | $8,963 | $47,001 | $10,963 | $36,038 |
| 2022 | $8,963 | $47,001 | $10,963 | $36,038 |
| 2021 | $8,781 | $46,999 | $10,962 | $36,037 |
| 2020 | $7,502 | $36,779 | $9,647 | $27,132 |
| 2019 | $7,343 | $39,978 | $9,647 | $30,331 |
| 2018 | $7,897 | $39,978 | $9,647 | $30,331 |
| 2017 | $7,986 | $37,097 | $7,893 | $29,204 |
| 2016 | $7,430 | $37,097 | $7,893 | $29,204 |
| 2015 | $6,798 | $37,097 | $7,893 | $29,204 |
| 2014 | $6,164 | $33,224 | $6,139 | $27,085 |
| 2013 | $6,043 | $33,224 | $6,139 | $27,085 |
Source: Public Records
Map
Nearby Homes
- 1720 N Cleveland Ave
- 1720 N Mohawk St
- 1741 N Mohawk St
- 1755 N Mohawk St
- 1706 N Fern Ct
- 1606 N Mohawk St Unit B
- 415 W Eugenie St
- 1718 N Sedgwick St
- 1849 N Mohawk St Unit 2
- 1849 N Mohawk St Unit 1
- 1646 N Orchard St Unit 2
- 1910 N Larrabee St Unit 1910
- 1515 N Mohawk St Unit 1
- 1520 N Hudson Ave Unit 3
- 1807 N Orleans St Unit 1S
- 1853 N Burling St
- 1515 N Hudson Ave Unit 2
- 1878 N Orchard St
- 1865 N Burling St
- 1841 N Orleans St
- 1717 N Mohawk St Unit D
- 1717 N Mohawk St Unit A
- 1717 N Mohawk St
- 1717 N Mohawk St
- 1717 N Mohawk St
- 1717 N Mohawk St
- 1717 N Mohawk St Unit C
- 1715 N Mohawk St
- 1713 N Mohawk St
- 1719 N Mohawk St
- 1719 N Mohawk St
- 1719 N Mohawk St
- 1719 N Mohawk St
- 1719 N Mohawk St Unit G
- 1719 N Mohawk St Unit H
- 1725 N Mohawk St Unit 3N
- 1725 N Mohawk St Unit 2S
- 1725 N Mohawk St Unit 1S
- 1725 N Mohawk St Unit 3S
- 1725 N Mohawk St Unit 1N
Your Personal Tour Guide
Ask me questions while you tour the home.