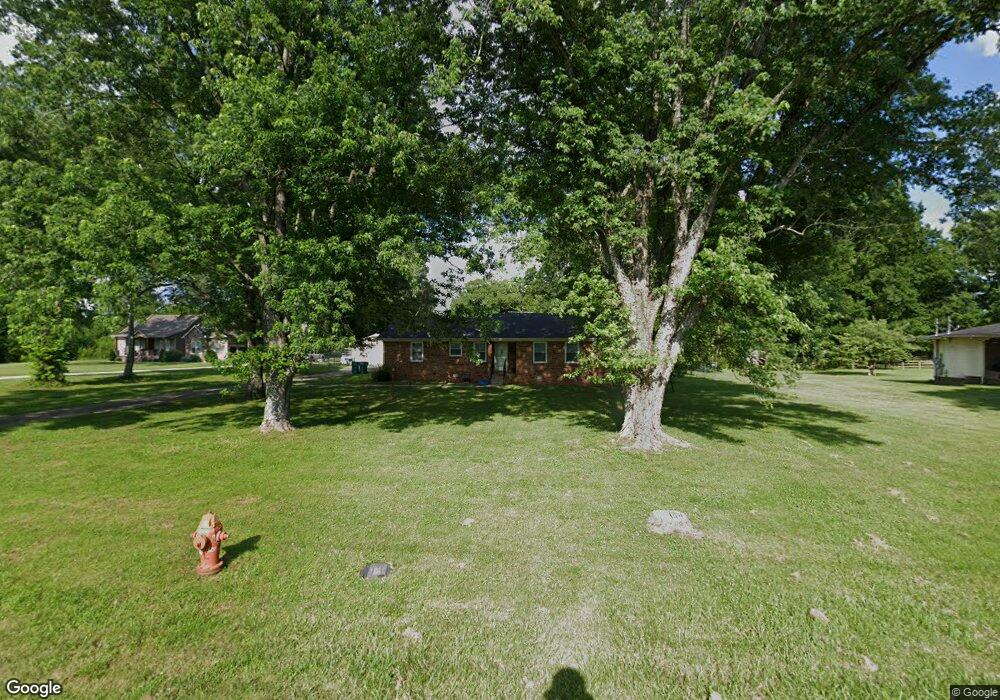
1717 Old Farmington Rd Lewisburg, TN 37091
Estimated Value: $239,000 - $355,000
--
Bed
2
Baths
1,509
Sq Ft
$184/Sq Ft
Est. Value
About This Home
This home is located at 1717 Old Farmington Rd, Lewisburg, TN 37091 and is currently estimated at $277,761, approximately $184 per square foot. 1717 Old Farmington Rd is a home located in Marshall County with nearby schools including Oak Grove Elementary School, Marshall Elementary School, and Westhills Elementary School.
Ownership History
Date
Name
Owned For
Owner Type
Purchase Details
Closed on
Nov 2, 2021
Sold by
Dillard Terry D and Stevenson Thomas C
Bought by
Dillard Terry D and Dillard Victoria L
Current Estimated Value
Home Financials for this Owner
Home Financials are based on the most recent Mortgage that was taken out on this home.
Original Mortgage
$140,000
Outstanding Balance
$128,089
Interest Rate
2.88%
Mortgage Type
Purchase Money Mortgage
Estimated Equity
$149,672
Purchase Details
Closed on
Apr 5, 2007
Sold by
Stevenson Thomas C
Bought by
Thomas and Thomas Stevenson L
Purchase Details
Closed on
Mar 15, 2005
Sold by
Cuff Faris L
Bought by
Thomas Stevenson and Thomas Bertha
Purchase Details
Closed on
May 31, 1996
Sold by
Cross Kenneth R
Bought by
Cuff Faris L
Purchase Details
Closed on
May 14, 1990
Bought by
Cross Kenneth R and Cross Mary E
Purchase Details
Closed on
Oct 17, 1987
Bought by
Peck Bobby
Create a Home Valuation Report for This Property
The Home Valuation Report is an in-depth analysis detailing your home's value as well as a comparison with similar homes in the area
Home Values in the Area
Average Home Value in this Area
Purchase History
| Date | Buyer | Sale Price | Title Company |
|---|---|---|---|
| Dillard Terry D | $175,000 | None Available | |
| Thomas | -- | -- | |
| Thomas Stevenson | $85,000 | -- | |
| Cuff Faris L | $77,500 | -- | |
| Cross Kenneth R | $55,000 | -- | |
| Peck Bobby | $48,000 | -- |
Source: Public Records
Mortgage History
| Date | Status | Borrower | Loan Amount |
|---|---|---|---|
| Open | Dillard Terry D | $140,000 |
Source: Public Records
Tax History Compared to Growth
Tax History
| Year | Tax Paid | Tax Assessment Tax Assessment Total Assessment is a certain percentage of the fair market value that is determined by local assessors to be the total taxable value of land and additions on the property. | Land | Improvement |
|---|---|---|---|---|
| 2024 | $795 | $43,700 | $6,875 | $36,825 |
| 2023 | $795 | $43,700 | $6,875 | $36,825 |
| 2022 | $795 | $43,700 | $6,875 | $36,825 |
| 2021 | $657 | $23,375 | $3,000 | $20,375 |
| 2020 | $657 | $23,375 | $3,000 | $20,375 |
| 2019 | $657 | $23,375 | $3,000 | $20,375 |
| 2018 | $608 | $22,000 | $3,000 | $19,000 |
| 2017 | $608 | $22,000 | $3,000 | $19,000 |
| 2016 | $669 | $20,775 | $3,000 | $17,775 |
| 2015 | $669 | $20,775 | $3,000 | $17,775 |
| 2014 | -- | $20,775 | $3,000 | $17,775 |
Source: Public Records
Map
Nearby Homes
- 1529 Joanne Cir
- 1401 Hobby Ln
- 1465 Old Farmington Rd
- 341 Holly Grove Rd
- 1408 Holly Grove Rd
- 2998 Verona Caney Rd
- 1755 Mcbride Rd
- 1800 Mcbride Rd
- 155 Landon Ln
- 1600 Larry Dospil Dr
- 380 Baxter Ave
- 1019 Curtis Spring Ln
- 188 Trey Dr
- Ashbury Plan at Spring Valley Estates - Grandview Collection
- Primrose Plan at Spring Valley Estates - Classic Collection
- 1011 Curtis Springs Ln
- Alan Plan at Spring Valley Estates - Grandview Collection
- 1013 Curtis Springs Ln
- 1015 Curtis Springs Ln
- 1019 Curtis Springs Ln
- 0 Old Farmington Rd Unit 1704885
- 0 Old Farmington Rd Unit 1606444
- 0 Old Farmington Rd Unit RTC2348472
- 1709 Old Farmington Rd
- 1721 Old Farmington Rd
- 1705 Old Farmington Rd
- 1730 Nashville Hwy
- 1780 Nashville Hwy
- 1700 Old Farmington Rd
- 1700 Old Farmington Rd
- 1700 Nashville Hwy
- 1650 Nashville Hwy
- 1630 Old Farmington Rd
- 1725 Nashville Hwy
- 1751 Nashville Hwy
- 1781 Nashville Hwy
- 2110 Old Farmington Rd
- 1640 Nashville Hwy
- 1776 Old Farmington Rd
- 1836 Nashville Hwy