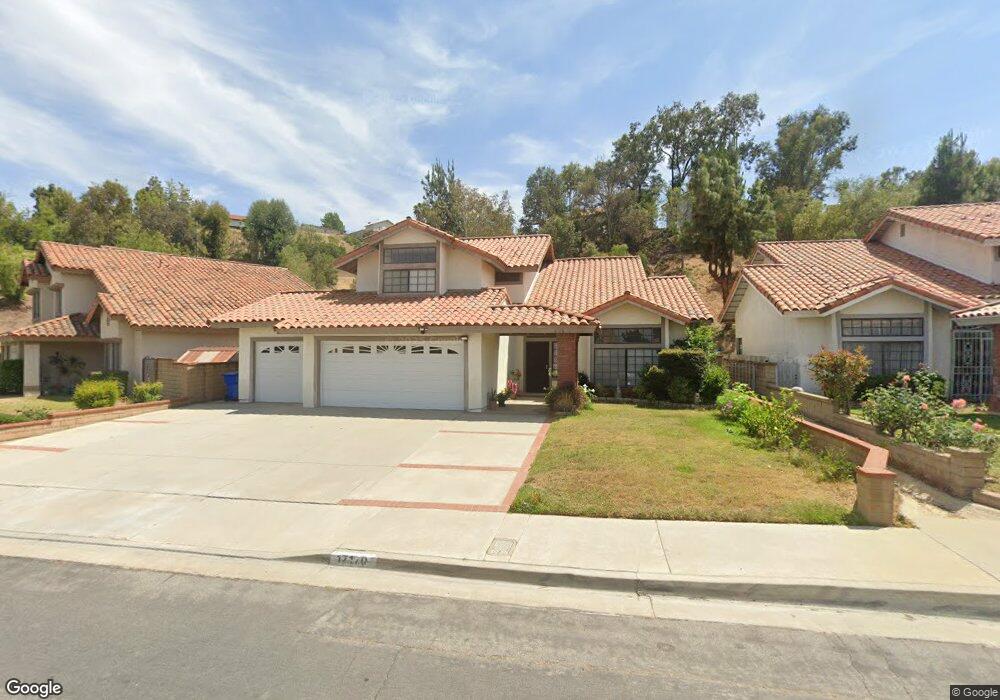
17170 Highwood Rd Hacienda Heights, CA 91745
Estimated Value: $1,139,000 - $1,201,000
4
Beds
3
Baths
2,307
Sq Ft
$508/Sq Ft
Est. Value
About This Home
This home is located at 17170 Highwood Rd, Hacienda Heights, CA 91745 and is currently estimated at $1,172,964, approximately $508 per square foot. 17170 Highwood Rd is a home located in Los Angeles County with nearby schools including Wedgeworth Elementary School, Glen A. Wilson High School, and Molokan Elementary School.
Ownership History
Date
Name
Owned For
Owner Type
Purchase Details
Closed on
Nov 11, 2022
Sold by
Tseng Lisa Aijin
Bought by
Lisa A Tseng Hacienda Heights Revocable Trust
Current Estimated Value
Purchase Details
Closed on
May 12, 2014
Sold by
Tseng Tai Yih
Bought by
Tseng Lisa Aijin
Home Financials for this Owner
Home Financials are based on the most recent Mortgage that was taken out on this home.
Original Mortgage
$270,000
Interest Rate
4.31%
Mortgage Type
Purchase Money Mortgage
Purchase Details
Closed on
Oct 11, 2011
Sold by
Tseng Tai Y
Bought by
Tseng Greg and Tseng Lisa Aijin
Purchase Details
Closed on
Mar 28, 1995
Sold by
Tseng Tai Y and Tseng Mei N
Bought by
Tseng Tai Y and Tseng Mei N
Purchase Details
Closed on
Oct 3, 1994
Sold by
Verdugo Richard and Verdugo Carmen
Bought by
Tseng Mei N and Tseng Tai Y
Create a Home Valuation Report for This Property
The Home Valuation Report is an in-depth analysis detailing your home's value as well as a comparison with similar homes in the area
Home Values in the Area
Average Home Value in this Area
Purchase History
| Date | Buyer | Sale Price | Title Company |
|---|---|---|---|
| Lisa A Tseng Hacienda Heights Revocable Trust | -- | -- | |
| Tseng Lisa Aijin | $534,500 | Title 365 | |
| Tseng Greg | -- | Accommodation | |
| Tseng Tai Y | -- | -- | |
| Tseng Mei N | -- | First American Title Company |
Source: Public Records
Mortgage History
| Date | Status | Borrower | Loan Amount |
|---|---|---|---|
| Previous Owner | Tseng Lisa Aijin | $270,000 |
Source: Public Records
Tax History Compared to Growth
Tax History
| Year | Tax Paid | Tax Assessment Tax Assessment Total Assessment is a certain percentage of the fair market value that is determined by local assessors to be the total taxable value of land and additions on the property. | Land | Improvement |
|---|---|---|---|---|
| 2025 | $7,574 | $594,135 | $370,811 | $223,324 |
| 2024 | $7,574 | $582,487 | $363,541 | $218,946 |
| 2023 | $7,291 | $571,066 | $356,413 | $214,653 |
| 2022 | $7,076 | $559,870 | $349,425 | $210,445 |
| 2021 | $6,945 | $548,893 | $342,574 | $206,319 |
| 2019 | $6,744 | $532,614 | $332,414 | $200,200 |
| 2018 | $6,496 | $522,172 | $325,897 | $196,275 |
| 2016 | $6,008 | $501,897 | $313,243 | $188,654 |
| 2015 | $5,901 | $494,359 | $308,538 | $185,821 |
| 2014 | $5,731 | $484,677 | $302,495 | $182,182 |
Source: Public Records
Map
Nearby Homes
- 17070 Colima Rd Unit 284
- 16978 Colchester Way Unit 140
- 1804 Ewing Ct
- 2367 Mountain Brook Dr
- 2521 Mountainview Ct
- 1607 Waverly Glen Way
- 1507 Eagle Park Rd
- 16907 Ridge Park Dr
- 16500 Ember Glen Rd
- 1807 Avenida Del Canada
- 1948 Calle Bogota
- 1440 Forest Glen Dr
- 2021 Elderway Dr
- 17712 Nearbank Dr
- 1740 Rada Rd
- 2048 Calle Bogota
- 1469 Forest Glen Dr Unit 193
- 1437 Forest Glen Dr
- 17834 Calle Los Arboles
- 1426 Countrywood Ave Unit 51
- 17162 Highwood Rd
- 17184 Highwood Rd
- 17154 Highwood Rd
- 17171 Royal View Rd
- 17183 Royal View Rd
- 17159 Royal View Rd
- 17146 Highwood Rd
- 17173 Highwood Rd
- 17165 Highwood Rd
- 17181 Highwood Rd
- 17139 Royal View Rd
- 17147 Royal View Rd
- 17157 Highwood Rd
- 17189 Highwood Rd
- 17138 Highwood Rd
- 17151 Highwood Rd
- 17149 Highwood Rd
- 17197 Highwood Rd
- 17135 Royal View Rd
- 17130 Highwood Rd