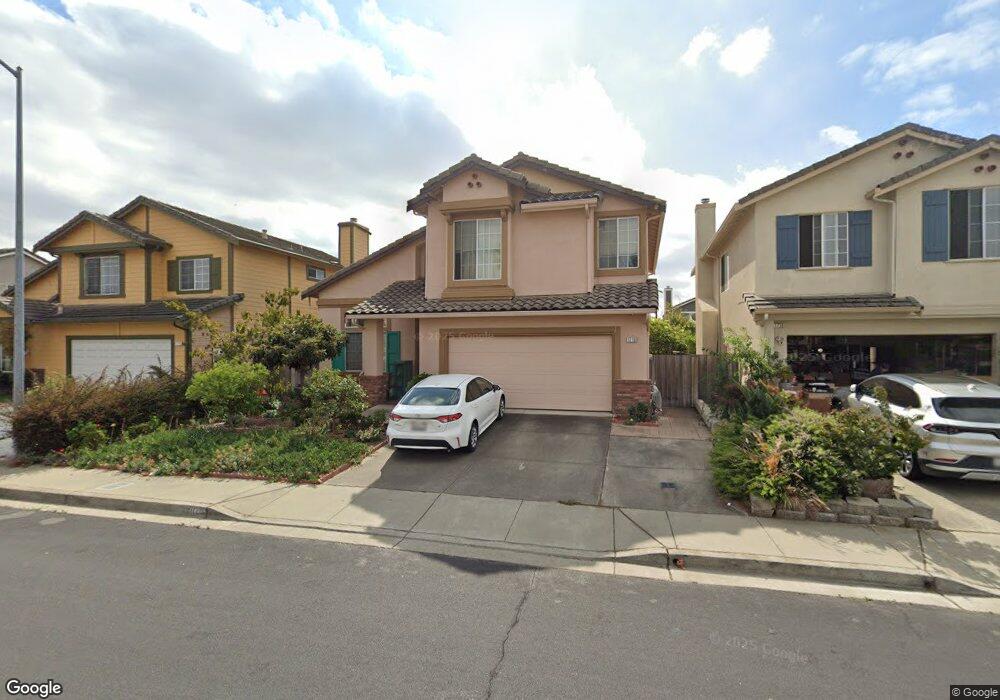
1718 Canterbury Ln Hayward, CA 94544
Tennyson-Alquire NeighborhoodEstimated Value: $997,000 - $1,194,124
4
Beds
3
Baths
2,011
Sq Ft
$551/Sq Ft
Est. Value
About This Home
This home is located at 1718 Canterbury Ln, Hayward, CA 94544 and is currently estimated at $1,109,031, approximately $551 per square foot. 1718 Canterbury Ln is a home located in Alameda County with nearby schools including Palma Ceia Elementary School, Anthony W. Ochoa Middle School, and Mt. Eden High School.
Ownership History
Date
Name
Owned For
Owner Type
Purchase Details
Closed on
Apr 5, 2013
Sold by
Ren Wenting
Bought by
Yang Ping
Current Estimated Value
Purchase Details
Closed on
Mar 14, 2013
Sold by
Yang Ping and Ren Wenting
Bought by
Yang Ping and Ren Wenting
Purchase Details
Closed on
Nov 5, 2010
Sold by
Yang Ping and Yang Patrick Ping
Bought by
Yang Ping and Ren Wenting
Purchase Details
Closed on
Nov 22, 1999
Sold by
Tirona Reginald J and Tirona Evelyn L
Bought by
Yang Shao Chun and Liu De Ju
Home Financials for this Owner
Home Financials are based on the most recent Mortgage that was taken out on this home.
Original Mortgage
$300,000
Interest Rate
3.45%
Purchase Details
Closed on
May 31, 1996
Sold by
Warmington Hayward Associates Lp
Bought by
Tirona Reginald J and Tirona Evelyn L
Home Financials for this Owner
Home Financials are based on the most recent Mortgage that was taken out on this home.
Original Mortgage
$211,250
Interest Rate
8.09%
Create a Home Valuation Report for This Property
The Home Valuation Report is an in-depth analysis detailing your home's value as well as a comparison with similar homes in the area
Home Values in the Area
Average Home Value in this Area
Purchase History
| Date | Buyer | Sale Price | Title Company |
|---|---|---|---|
| Yang Ping | -- | Old Republic Title Company | |
| Yang Ping | -- | Old Republic Title Company | |
| Yang Ping | -- | Old Republic Title Company | |
| Yang Shao Chun | $384,000 | American Title Co | |
| Tirona Reginald J | $265,000 | First American Title Guarant |
Source: Public Records
Mortgage History
| Date | Status | Borrower | Loan Amount |
|---|---|---|---|
| Previous Owner | Yang Shao Chun | $300,000 | |
| Previous Owner | Tirona Reginald J | $211,250 |
Source: Public Records
Tax History Compared to Growth
Tax History
| Year | Tax Paid | Tax Assessment Tax Assessment Total Assessment is a certain percentage of the fair market value that is determined by local assessors to be the total taxable value of land and additions on the property. | Land | Improvement |
|---|---|---|---|---|
| 2025 | $7,517 | $583,165 | $177,049 | $413,116 |
| 2024 | $7,517 | $571,595 | $173,578 | $405,017 |
| 2023 | $7,406 | $567,251 | $170,175 | $397,076 |
| 2022 | $7,261 | $549,131 | $166,839 | $389,292 |
| 2021 | $7,204 | $538,230 | $163,569 | $381,661 |
| 2020 | $7,128 | $539,642 | $161,892 | $377,750 |
| 2019 | $7,182 | $529,063 | $158,719 | $370,344 |
| 2018 | $6,760 | $518,691 | $155,607 | $363,084 |
| 2017 | $6,640 | $508,523 | $152,557 | $355,966 |
| 2016 | $6,284 | $498,554 | $149,566 | $348,988 |
| 2015 | $6,141 | $491,066 | $147,320 | $343,746 |
| 2014 | $5,776 | $481,447 | $144,434 | $337,013 |
Source: Public Records
Map
Nearby Homes
- 29043 Windemere Rd
- 29046 Rochester Ct
- 1440 Buckingham Way
- 1352 Chelsea Way
- 28882 Miranda St
- 29270 Sandburg Way Unit 234
- 28845 La Corona St
- 29424 Providence Way
- 1439 Almeria Dr
- 1438 Salamanca Ave
- 878 Folsom Ave
- 1127 Hat Creek Way
- 29235 Lone Tree Place
- 1541 Ortega Ave Unit 39
- 29255 Harpoon Way
- 1587 de Lemos Ave
- 1580 Balein Ct Unit 14
- 29223 Whalebone Way Unit 404
- 29223 Whalebone Way
- 28147 Murcia St Unit 324
- 1710 Canterbury Ln
- 1730 Canterbury Ln
- 29262 Stonebrook Ln
- 29202 Stonebrook Ln
- 29219 Chutney Rd
- 29235 Chutney Rd
- 29270 Stonebrook Ln
- 29254 Stonebrook Ln
- 29210 Stonebrook Ln
- 29251 Chutney Rd
- 1715 Canterbury Ln
- 29218 Stonebrook Ln
- 1727 Canterbury Ln
- 1707 Canterbury Ln
- 1735 Canterbury Ln
- 29267 Chutney Rd
- 29177 Chutney Rd
- 29226 Stonebrook Ln
- 1747 Canterbury Ln
- 29159 Chutney Rd