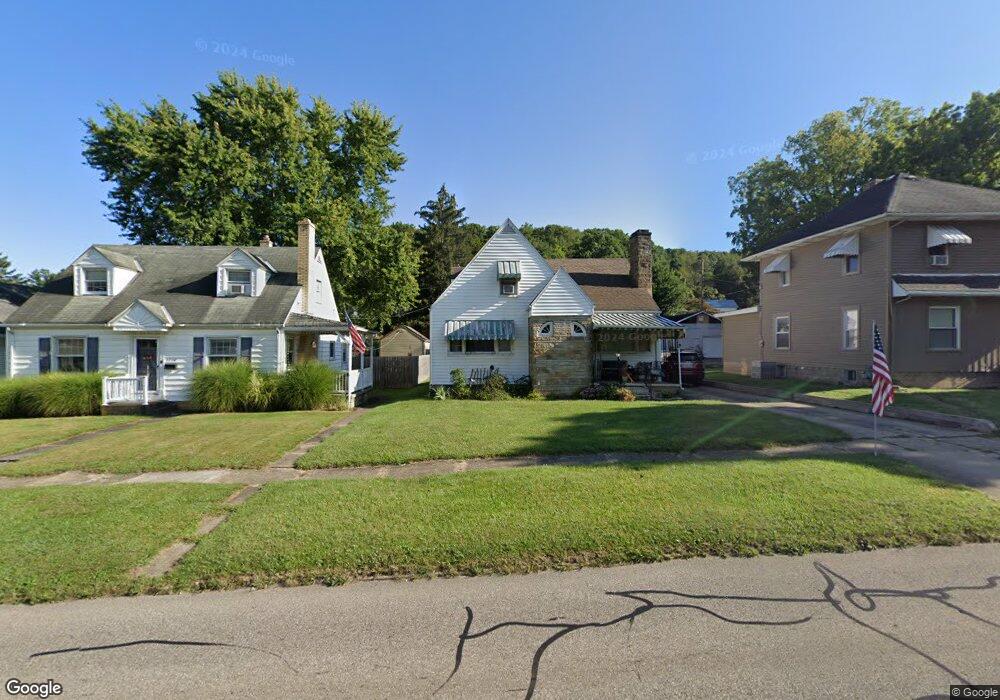
1718 Chestnut St Coshocton, OH 43812
Estimated Value: $121,000 - $154,000
4
Beds
3
Baths
1,604
Sq Ft
$85/Sq Ft
Est. Value
About This Home
This home is located at 1718 Chestnut St, Coshocton, OH 43812 and is currently estimated at $137,101, approximately $85 per square foot. 1718 Chestnut St is a home located in Coshocton County with nearby schools including Coshocton High School, Coshocton Opportunity School, and Sacred Heart School.
Ownership History
Date
Name
Owned For
Owner Type
Purchase Details
Closed on
Mar 17, 2006
Sold by
Hochstetler Gerald D and Hochstetler Veronica Fae
Bought by
Medley Brent M and Weaver Nicole C
Current Estimated Value
Home Financials for this Owner
Home Financials are based on the most recent Mortgage that was taken out on this home.
Original Mortgage
$62,300
Outstanding Balance
$35,645
Interest Rate
6.38%
Mortgage Type
New Conventional
Estimated Equity
$101,456
Purchase Details
Closed on
Dec 20, 2005
Sold by
Deutsche Bank National Trust Co
Bought by
Hochstetler Gerald D
Purchase Details
Closed on
Nov 26, 2004
Sold by
Lindell Phillip W
Bought by
Long Beach Mortgage Loan Trust 2002-5
Purchase Details
Closed on
Dec 10, 2002
Sold by
Lindell Ann E
Bought by
Lindell Phillip W
Purchase Details
Closed on
Apr 5, 2001
Sold by
Lindell Ann E
Bought by
Lindell Ann E
Purchase Details
Closed on
Oct 6, 1997
Sold by
Horn Sarah G
Bought by
Wiggins Betty Lou
Create a Home Valuation Report for This Property
The Home Valuation Report is an in-depth analysis detailing your home's value as well as a comparison with similar homes in the area
Home Values in the Area
Average Home Value in this Area
Purchase History
| Date | Buyer | Sale Price | Title Company |
|---|---|---|---|
| Medley Brent M | $58,000 | None Available | |
| Hochstetler Gerald D | $37,125 | Sovereign Title Agency Llc | |
| Long Beach Mortgage Loan Trust 2002-5 | $40,000 | -- | |
| Lindell Phillip W | -- | -- | |
| Lindell Ann E | -- | -- | |
| Wiggins Betty Lou | $79,000 | -- |
Source: Public Records
Mortgage History
| Date | Status | Borrower | Loan Amount |
|---|---|---|---|
| Open | Medley Brent M | $62,300 |
Source: Public Records
Tax History Compared to Growth
Tax History
| Year | Tax Paid | Tax Assessment Tax Assessment Total Assessment is a certain percentage of the fair market value that is determined by local assessors to be the total taxable value of land and additions on the property. | Land | Improvement |
|---|---|---|---|---|
| 2024 | $1,248 | $30,210 | $5,390 | $24,820 |
| 2023 | $1,248 | $25,351 | $3,770 | $21,581 |
| 2022 | $1,209 | $25,351 | $3,770 | $21,581 |
| 2021 | $1,211 | $25,351 | $3,770 | $21,581 |
| 2020 | $1,370 | $27,801 | $3,850 | $23,951 |
| 2019 | $1,387 | $27,801 | $3,850 | $23,951 |
| 2018 | $1,270 | $27,801 | $3,850 | $23,951 |
| 2017 | $1,197 | $23,332 | $3,595 | $19,737 |
| 2016 | $1,148 | $23,332 | $3,595 | $19,737 |
| 2015 | $577 | $23,332 | $3,595 | $19,737 |
| 2014 | $1,011 | $22,054 | $3,595 | $18,459 |
Source: Public Records
Map
Nearby Homes
- 1720 Chestnut St
- 1710 Chestnut St
- 1724 Chestnut St
- 1732 Chestnut St
- 1713 Hay Ave
- 1707 Chestnut St
- 1719 Hay Ave
- 204 N 17th St
- 1742 Chestnut St
- 1646 Chestnut St
- 1703 Chestnut St
- 1717 Chestnut St
- 1725 Chestnut St
- 1711 Hay Ave
- 1744 Chestnut St
- 1640 Chestnut St
- 1631 Hay Ave
- 1727 Chestnut St
- 1647 Chestnut St
- 1729 Chestnut St